Sri Lanka Equity Analytics

We are a team of professionals with many years of experience and expertise in the equity and capital market of Sri Lanka. Voice: +1 (206) 426 1561

Get The Latest News

Sign up to receive latest news

Tuesday, July 27, 2010

Sri Lanka Seylan Bank (SEYB) - Regaining Confidence...


Sri Lanka’s banking and financial services sector has been a steady contributor to the economy (10.3% to the GDP in 2009) and been one of the most sought after sectors in the Colombo bourse (that gained nearly 110% in terms of market capitalization and sector index gained near 124% during the year 2009). Going forward with the favorable economic outlook, growth potential of banks due to healthy capitalization levels and improving asset quality in the banking sector we see the sector performing above expectations in the coming years.

SEYB which was a one of the major player in the retail banking industry in the past is now showing signs of recovery after its set back in 2008 due to a run on the bank as a result of depositors losing confidence in the bank.

Deposits recoded a marginal 1.5% growth in 1H2010. Bank showing signs of recovering its lost deposits during 1H2010 where it recorded marginal growth after its steep decline in 2008. Further it is also encouraging to see a shift in the deposit mix more towards low cost current and savings (CASA) products. We believe SEYB would return to normalcy during the next 2 years recovering its deposits which would help them to grow from there onwards.

Improvement in non performing loans (NPLs) during 1H2010. NPL’s in 2009 peaked up to near LKR30.0 bn whilst the gross NPL ratio for 2009 stood at 29.3% (which was the highest in the industry). However with the emphasis on recovering the bad loans under new management we saw a reduction in NPL’s in 1H2010 which stood at LKR27.5 bn with the gross NPL ratio still being the highest in the industry at 25.6% (industry NPL ratio is circa 8%).

Healthy interest margins and capitalization levels. SEYB has always maintained its interest margins par with the sector due to its retail focus and differentiated service levels where the banks current interest margins stands at 5.5%. Further bank is also comfortably capitalized with in regulatory limits where the bank does not need to raise capital for its expansions in the near future.

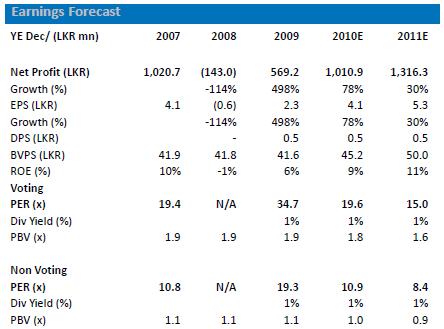
Forecast 2010E earnings to rise by 78% YoY to LKR1,010.9 mn. With banks promising recovery process as stated above coupled with necessary measures to curtail cost and improve its core business activities we also believe SEYB would be in a position to benefit from the expected industry wide upside with strong macro economic position of the country. Based on these assumptions we are expecting a 78% YoY increase in projected 2010E earnings to LKR1,010.9 mn and projected 2011E earnings to rise by 30% to LKR1,316.3 mn.

Non voting share offers good value on 10.9x forecasted 2010E earnings. The non voting share which is trading at a near 44% discount to the voting share offers good value on 10.9x (compared to the sector PE of 13.8x) forecasted 2010E earnings and is attractive at 8.4x forecasted 2011E earnings whilst trading on 1.0x PBV. Given the above assumptions on recovery and industry wide upside we rate SEYB (Non Voting) a BUY.

The voting share is trading near 50% premium to the financial sector, However we believe given SEYB’s branch network and reach and the recovery in its core business coupled with the reviving macro economy and growth potential in the banking sector SEYB has further upside, hence we rate SEYB (Voting share) a HOLD.

Overview
Banking sector overview
Sri Lanka’s banking and financial services sector has been a steady contributor to the economy (10.3% to the GDP in 2009) and been one of the most sought after sectors in the Colombo bourse (that gained nearly 110% in terms of market capitalization and sector index gained near 124% during the year 2009). We saw the asset quality in the banking sector deteriorating in the recent past due to high interest rates and inflationary environment coupled with the weakening macro environment both globally and locally, despite the healthy capital adequacy levels that the banks maintained throughout.

Nevertheless, with the improving macro economic outlook for Sri Lanka and easing interest rates and inflation we expect the banking sector to be a prime beneficiary of this positive momentum. Further we expect that with the end of the 3 decade long seperatist conflict which has opened up a vast cash rich area will provide ample opportunities for banks to grow in the coming years.

Lower lending rates coupled with vast development projects which are underway in the island will enable the banks to grow their loan portfolios. Further with North and East integrated into the economy we foresee branch network of the banks expanding (near 35 new branches were opened after May 2009) and we can expect a growth in their deposit portfolios. In addition, the local banking industry is highly regulated and the issuance of new banking licenses in virtually a non-sorter as Central Bank of Sri Lanka (CBSL) discourages new entrants where we already have circa 23 players (both local and foreign). This provides the existing operators to enjoy the benefits of this upside. Going forward with the favorable economic outlook, growth potential of banks due to healthy capitalization levels and improving asset quality in the banking sector we see the sector performing above expectations in the coming years.

Company overview
Seylan Bank was incorporated in 1987 and obtained a listing for its ordinary shares on the Colombo bourse in 1989. Today the bank stands as the 4th largest private commercial bank in Sri Lanka with an asset base of LKR142.9 bn whilst operating an island wide branch network of 94.

From the inception the bank was more focus on the retail sector offering differentiated (5% bonus on interest reinvested in fixed deposits, 1% bonus interest on minimum balances of savings accounts) and customer oriented services (extended weekday banking hours as well as Saturday banking). SEYB enjoyed immediate success reporting an after tax profit of LKR11.3 mn in 1988 where the profitability has grown at a 19 year CAGR of 26% from 1988-2007. In 2008 bank faced a confidence crisis where customers were demanding for withdrawals due banks associates with Ceylinco group (held near 24%) and the SEYB recorded a loss of LKR143.0 in 2008. Today the bank is recovering from the crisis situation under the new management and the bank has potential for upside (along with the expected industry upside) given the bank will return to its normal operating levels by end of 2010.

The chain of events that happened in year 2008 led to the historic run on SEYB in late 2008 due to failure of financial institutions and loss public confidence in September 2008 an unlisted finance company “Sakvithi Investments” defrauded a near LKR900 mn worth of deposits (individual responsible for the fraud fled the country) after luring exceptionally high rates of returns.

With the instability and fear created by these unregistered finance companies made depositors demand back their funds at Golden Key (which was offering higher rates of 24-30% p.a.) a Ceylinco owned company. Finally all these incidents led to collapse of Golden Key and directors were sued for management malfunction.

Subsequent to the Golden Key crisis there was a run on SEYB where, by then the Ceylinco group (was the holding company of Golden Key) held 24% of the bank and Dr. Lalith Kotelawala who was the chairman of Ceylinco group was also the chairman/managing director of SEYB by that time.

Further bank also had reckless related party lending to most of the Ceylinco group companies which brought about huge NPL’s (peaked up to LKR30 bn in 2008) from Ceylinco group companies after most of them collapsed.

Recovery process under new management
In December 2008 Ceylinco group divested its interest in SEYB where two state institutions (Sri Lanka Insurance Corporation and Bank of Ceylon) bought 25% of SEYB becoming the largest shareholder as at 31st December 2009. Following the take over, CBSL handed over the management of SEYB to Bank of Ceylon and was asked to appoint a new board in the meantime. Decisive action by CBSL to restore SEYB from its crisis was commendable and it also protected the entire financial services sector from further crisis. Under the new management the main priority was to restore public confidence and adopt appropriate risk management strategies.

Future outlook
During latter part of 2009 and 1Q2010 SEYB showed signs of recovery where they were able to bring down the NPL's (from a high of LKR31 bn in 2009 to near LKR27 bn by 1Q2010), curtail costs (near 20% YoY reduction in 2009), improve capital adequacy, strengthen liquidity position (stood at 29% end of 2009 compared to regulatory limit of 20%), improve net interest income and increase foreign remittances.

The bank drew up a 3 year strategic plan from 2009-2011 emphasizing to improve seven key performance indicators such as ROE, NPL ratio, cost to income ratio, profit after tax etc. Further the bank also has taken necessary steps to attract deposits, improve recoveries and managing its business risks. It is also noteworthy that with all these healing processes the bank is also looking at expansion plans for growth mainly in North and East.

Deposits
SEYB’s deposits recorded a steady growth during 2002-2004 where it saw a sizeable leap in 2005 but from 2005 onwards growth in customer deposits slowed down. Banks deposit base dropped considerably in 2008 mainly on the back of global financial turmoil and high inflationary situation in the country. However after 2008 the banking sector deposit growth recovered with declining inflation and recovery in the global crisis (9% YoY growth) in contrast SEYB recorded negative growth mainly because of the internal crisis (Ceylinco group crisis) the bank under went during 2H2008 and early 2009. With the new management in place and sound credit policies adopted the bank has been able build up the confidence of the customer where it has helped to attract the lost deposits to the bank (deposits recoded a marginal 1.5% growth in 1H2010).

Therefore going forward with the improving macro economic conditions and the upside in the banking sector we believe SEYB would be able to recover its lost deposits and will return to normalcy during the next 2 years which would help them to grow from there onwards.


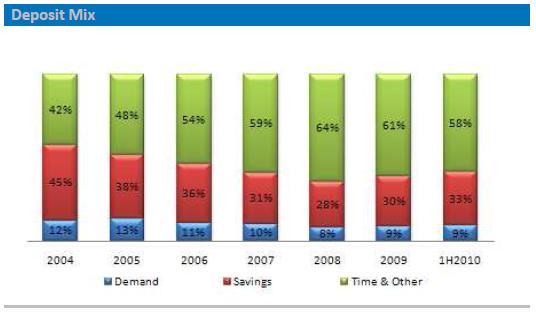
Another positive sign we are seeing the banking sector is the shift in the deposit mix towards low cost CASA products. This is evident in SEYB as well where they have been able to grow its savings products whilst reducing the dependence on high cost time deposits. In 2008, 64% of SEYB’s total deposits came from time deposits where as the contribution from CASA was 36% which was mainly due to high interest rates prevailed at that time. But during 1H2010 saw a 42% contribution from CASA which has helped the bank to reduce their interest cost.


From the total deposits Western province contributes to near 65% where the bank operates 46 branches with average deposit base of LKR1.5 bn per branch. 8 branches in the North & East contributes 5% of to the total where the average deposit base per branch stands near LKR0.8 bn. Going forward with the newly liberated North & East integrated into the main stream economy we expect the contributions from the North & East branches to increase.

Loans
SEYB’s loan growth surged from 2001-2005 at a CAGR of 20.4% mainly backed by the industry wide growth momentum. However we see a notable dip in banks loan growth from 2006-2008 due to contractionary monetary policies adopted by CBSL to curtail inflation coupled with the heightened conflict situation which discouraged new investments.

We saw the industry loan growth slowly recovering from 2008 onwards where as SEYB recorded a 23% dip in its loan book in 2009 which was the largest contraction compared to its peers. This was mainly due to the high proportion of the loans being categorized as non performing loans. (2009 SEYB had the highest NPL ratio of 29.3%) During 1H2010 we saw a marginal dip of 1% in banks net loans due to growth slower private sector credit growth during 1H2010 but we saw an improvement in the NPL position of SEYB in 1H2010. (NPL ratio during 1H2010 stood at 25.6%).


In terms of the sector wise break down we see majority of the loans granted to the housing sector where it contributed for circa 17% of the total loan book whilst consumption sector contributed for 10%. However it is also note worthy that housing and consumption sectors are the sectors that will mostly affect the asset quality.

SEYB is concentrated more on short term loans where it is circa 51% of the total portfolio where as medium term loans contribute 25% and contribution from long term loans stands at 24%. Further SEYB from the inception had more focus on the retail segment (which yield higher margins) and currently operate at a retail : corporate mix of near 70:30. Bank also has seen increasing demand in its pawning business (which is a highly profitable business with low risk) specially from Northern province, where currently pawning contributes for circa 6-7% of the total advances.

Interest Margin
SEYB has been able to enjoy above 5% interest margins during the last five years (even in times of crisis) due to its retail focus and differentiated service. Banks interest margin of 5.5% was in line with the industry average of circa 5%.


Asset Quality
SEYB’s non performing loans (NPL) were at manageable levels (gross NPL ratio near 8%) during 2005-2008 but with reckless lending patterns which resulted in NPL’s to peak up to near LKR30 bn in 2009 whilst the gross NPL ratio for 2009 stood at 29.3% (which was the highest in the industry). However with the emphasis on recovering the bad loans under new management we saw a reduction in NPL’s in 1H2010 which stood at LKR27.5 bn however the gross NPL ratio is still the highest in the industry at 25.6% (industry NPL ratio is circa 8%).


Capital Adequacy
Bank has improved its capital position after it fell below regulatory limits in 2008 where the Tier II CAR stood at 9.4% vs 10% regulatory limit. Bank is comfortable with its current capitalization level (Tier I at 10.6% and Tier II at 12.8% compared to regulatory limits of 5% & 10%). Further Fitch Ratings Lanka Ltd’s rating on SEYB is BBB+ and the outlook is stable.

Financial Performance
SEYB was growing gradually during 2005-2007 where the major set back occurred in 2008 where the group recorded a loss of LKR143.0 mn. It is also noteworthy in 2008 banks operating cost increased exceptionally than its NII largely owing to high provisioning costs. However we saw the bank improving its performance during 2009 under the new management where the bank recorded a profit of LKR569.2 mn (up 498% YoY). Main reason behind improvement in operations was reducing operating costs and provisions despite business volumes were contracted. Further it is also encouraging to see SEYB recording a profit of LKR507.3 mn in 1H2010.


In terms of profitability ratios we saw SEYB maintained the interest margins at circa 5% levels. However average return on equity and average return on assets fell drastically below industry average in 2008 due to poor utilization of shareholder funds and mismanagement of resources. But bank recovered during 2009 which was reflected in its profitability ratios where the bank recorded improved ROAE of 9.4% and ROAA of 1.2% (Still below industry averages) end of 1H2010.


With higher interest rates we see major contribution (89%) from interest income to total income in 2009. However with rates reducing interest income contribution will decline marginally in the coming years. But we see a notable contribution coming from fee based income in 1H2010 where majority of this is through foreign worker remittances (where total remittances grew by near 14% YoY during 2009). Therefore going forward with the expected circa 15% YoY growth in remittances we believe SEYB will also grow their fee based income part through its partnerships with MoneyGram International, XPRESS MONEY and EzRemit.
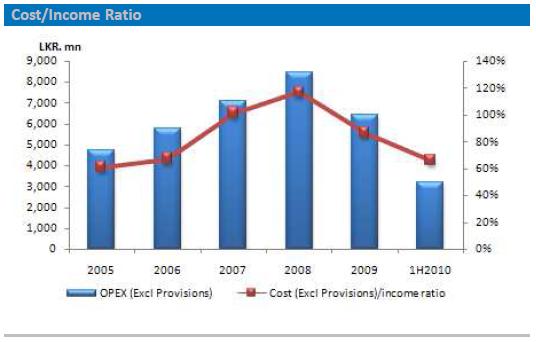

SEYB’s cost to income ratio has been the highest in the industry where it peaked to 117% in 2008 largely owing to higher staff cost. In 2008 bank employed 4,354 employees as compared to 4,041 employed by the largest private commercial bank in the country. Therefore it emphasizes the over staffing problem the bank had over the past hiking up the operating costs. The new management has adopted measures to curtail costs and address the over staffing problem where the bank was able to bring down the cost to income ratio to 66% by 1H2010 (but still was the highest in the industry).


Areas to improve in the future

  • SEYB’s cost to income ratio of 66% is the highest in the industry (where industry average is around 55%) and bank also has an overstaffing issue to address (nearly half the size of countries largest private commercial bank in terms of assets but it employees virtually the same number of employees). Going forward tha bank need to address this issue where we have witnessed the bank’s new management have adopted few cost rationalization strategies to reduce cost.


  • SEYB’s NPL ratio, ranging from just over 11% to more than 25% since reporting began in 1998. Bank has the highest NPL ratio among its peers and exceedingly high compared with the industry average of 8%. Bank adopted various measures to bring down its NPL’s (execute legal action, stop lending to Ceylinco group etc.) where we saw banks gross NPL ratio improving to circa 25% from a high of 29%.


  • Profitability measures such as ROE and ROA fell significantly below the industry norms during the past two years. Therefore the company has to take the challenge of improving the profitability measures in the coming years through its wider reach and improving core business.


Valuation
Forecast 2010E earnings to rise by 78% YoY to LKR1,010.9 mn. With banks promising recovery process where we believe the bank would be able to reduce its NPLs from its current LKR27 bn, adopt necessary measures to curtail cost and improve its core business activities. We also believe SEYB would be in a position to benefit from the expected industry wide upside with strong macro economic position of the country. Based on these assumptions we are expecting a 78% YoY increase in projected 2010E earnings to LKR1,010.9 mn and projected 2011E earnings to rise by 30% to LKR1,316.3 mn.

Non voting share offers good value on 10.9x forecasted 2010E earnings. share has good value on 10.9x (compared to the sector PE of 13.8x) forecasted 2010E earnings and is attractive at 8.1x forecasted 2011E earnings whilst trading on 1.0x PBV. The non voting share which is trading at a near 44% discount to the voting share where the normal discount between the voting and non voting share in the banking sector is 25- 30%. Therefore we believe the gap between SEYB.N and SEYB.X should narrow in the future and given recovery in its core business that we have seen during 1H2010 coupled with the reviving macro economy and growth potential in the banking sector we rate Given the above assumptions on recovery and industry wide upside we rate SEYB (Non Voting) a BUY.

The voting share currently trades at 19.6x projected 2010E earnings and 15.0x on projected 2011E earnings whilst trading on 1.8x PBV. The voting share is trading near 50% premium to the financial sector, However we believe given SEYB’s branch network and reach and the recovery in its core business that we have seen in 1H2010 coupled with the reviving macro economy and growth potential in the banking sector SEYB has further upside, hence we rate SEYB (Voting share) a HOLD.
»»  read more

Seylan Bank’s (SEYB) net profit up 66% YoY during -2Q2010


Overview
Seylan Bank (SEYB) was incorporated in 1987 and obtained a listing for its ordinary shares on the Colombo bourse in 1989. Today the bank stands as the 4th largest private commercial bank in Sri Lanka with an asset base of LKR142.9 bn whilst operating an island wide branch network of 94. Today the bank is recovering from the crisis situation under the new management and the bank has potential for upside (along with the expected industry upside) given the bank will return to its normal operating levels by end of 2010.

SEYB’s net profit has grown by 66% YoY to LKR311.8 mn in 2Q2010 enabling cumulative 1H2010 earnings to grow by 169.8% YoY to LKR507.3 mn. Net profit growth during the quarter was mainly on the back of 37% YoY increase in net interest income and 29% YoY reduction in provisioning cost. With the expected economic growth the loan growth expected to gather momentum from 2H2010 onwards coupled with improving asset quality and healthy capitalization levels banking sector outlook remains positive. SEYB’s net interest margins are expected to be intact at around 5%, whilst continuing to benefit from an island wide branch network. We are revising up our forecast 2010E net profit at LKR1,010.9 mn (up 78% YoY) and projected 2011E net earnings to LKR1,316.3 mn (up 30% YoY). Thus the voting share is trading on
19.6x forecasted 2010E net profit and 15.0x projected 2011E net earnings, 1.8X PBV. The non voting share is attractive on 10.9x forecast 2010E net profit, 8.4x projected 2011E net earnings and 1.0x PBV .


SEYB’s interest income has dropped by 20.9% YoY to LKR4,204.1 mn largely due to the high non performing loans and low interest rates but on the contrary SEYB’s interest expenses have dipped by 43.2% YoY to LKR2,183.0 mn which has weathered the negative impact on interest income enabling the bank to improve their NII.


Bank’s OPEX has increased by 4.3% YoY mainly on the back of a 8.1% YoY increase in personnel expenses whilst all other expenses have been kept in check. Further it is also encouraging to see during 1H2010 banks OPEX has reduced by 1.8% YoY which has helped the cost/income ratio to come down to 66%.

Improved NII levels and marginal increase in OPEX have helped the bank to record a growth of 112.8% YoY to LKR893.9 mn in 2Q2010.

Provisioning cost has reduced by 29.2% YoY to LKR167.7 mn in 2Q2010 mainly due to 10.8% YoY reduction in specific to LKR360.9 mn and 90.8% YoY improvement in recoveries to LKR202.0 mn.
Value added tax on financial services has increased by 158.1% YoY to LKR189.0 mn and corporate tax has increased by 106.7% YoY to LKR193.4 mn which in turn has increased the total tax bill. Effective tax rate as at 30th June stood at 56%.

Bank’s bottom line has grown by 66.0% YoY to LKR311.8 mn mainly on the back of improved NII and reduction in provisioning costs despite increase in total tax bill and marginal increase in OPEX. Banks cumulative 1H2010 earnings have grown 169.8% to LKR507.3.

Bank managed to reduce its non performing loans by 2.5% YoY to LKR27.5 bn during the quarter. Thus gross NPL ratio has witnessed a considerable improvement to 25.6% in 2Q2010 from 29.3% in December 2009 and Net NPL ratio improved to 18.4% from 22.3%. However compared to the industry average of circa 8% SEYB’s NPL ratios are still at high levels.

SEYB’s loan book has recorded a 2.2% YoY growth in 2Q2010 to LKR64.1 bn where we saw the private sector credit growth (2.2% YoY growth in May)picking up during the 2Q2010.

Deposit base grew by 1.1% to LKR107.0 bn during 2Q2010 mainly due to growth in savings and demand deposits. Further we see a shift in the deposit mix towards low cost CASA deposits which will help SEYB to reduce it funding costs.


SEYB is showing signs of recovery from the financial turmoil which it underwent in 2008. Therefore on the back of the bank’s recovery, favourable macro economic environment coupled with expected credit growth in 2H2010 and growth potential for the banking sector we forecast 2010E net profit to rise by 78% YoY to LKR1,010.9 mn.

The voting share currently trades at 19.6x projected 2010E earnings and 15.0x on projected 2011E earnings whilst trading at 1.8x PBV. The voting share is trading at near 50% premium to the sector, however given SEYB’s branch network and reach and the recovery in its core business that we have seen during 1H2010 coupled with the reviving macro economy and growth potential in the banking sector SEYB.N. has further upside, hence we rate SEYB.N a HOLD

The non voting share is attractive at 10.9x projected 2010E earnings and 8.4x on projected 2011E earnings whilst trading at 1.0x PBV. The non voting share trades near 44% discount to the voting share where the normal discount between the voting and non voting share in the banking sector is 25-30%. Therefore we believe the gap between SEYB.N and SEYB.X should narrow in the future and given SEYB’s recovery in its core business that we have seen during 1H2010 coupled with the reviving macro economy and growth potential in the banking sector we rate SEYB.X a BUY
»»  read more

Royal Ceramics' net profits up 189%YoY to LKR382.5 mn in 1QFY11


Royal Ceramic's (RCL) has reported net earnings of LKR382.5 mn (up 189%YoY ) in 1QFY11 whilst the top line grew by 58%YoY. This was mainly driven by strong home builders demand, improved sales mix in the sizes of tiles (Bigger tiles tend to have higher margins) and increase in demand from hotel refurbishment projects and apartment developments.

RCL, the market leader in floor tiles with circa 45% market share has two manufacturing plants for floor tiles in Horana & Ehaliyagoda and one for sanitary ware in Homagama. Currently the floor tile production lines operate closer to 100% capacity to produce circa 10,500-11,000 sqm/day whilst the bathware currently produces circa 12,000 pieces/month where the installed capacity is a near 20,000-24,000 pieces per month. In order to meet the excess demand the company is planning to increase the Horana plant's capacity by 3,500 sqm per day by Jan'2011.

With the economic conditions improving and demand from both home builders and hotels and apartment towers picking up considerably and with the interest rates on the downward trend we revise our projected FY11E earnings upwards by 12.9% to reach LKR1,579.4 mn (up by 63%YoY). On top of the demand picking up in the country, the expected reconstruction boom in the North and East from drumming up the overall economic growth, the construction industry is expected to witness a turnaround. RCL is one of the prime beneficiaries as a leading player in the Western province and a dominant player in the country. With the company's short term plans to increase capacity in the existing production facilities we revise up our FY12E forecast also by 31% to LKR2,068.3 mn (up 31% YoY).


Yearly & Quarterly Performance
Net revenue grew 58% YoY to LKR1,152.4 mn in 1QFY11. RCL's net turnover has grown 58% YoY to LKR1,152.4 mn during 1QFY11 on the back of increased demand from home builders, hotel and apartment building projects. During 1QFY11 the sales volume grew by near 50%YoY whilst there has been no increase sales price.

Gross profit has risen by 51% YoY to LKR516.2 mn in 1QFY11. RCL's cost of sales has increased by 64.3% YoY to LKR636.2 mn in 1QFY11 where the company has posted gross profit of LKR516.2 mn in 1QFY11 (up 51% YoY). The gross profit margin has dropped marginally to 44.8%.

EBIT has increased by 73% YoY to LKR255.2 mn in 1QFY11. The company's administrative expenditure has increased to LKR82.3 mn (up 28.4% YoY) in 1QFY11 whilst distribution expenses have risen by 37.2% YoY to LKR178.7 mn on the back of increased expenses on the sales network of 41 showrooms. Consequently, RCL has recorded an EBIT of LKR255.2 mn in 1QFY11 (up 73% YoY) whilst the EBIT
margin has grown to 22.1% during the quarter from 20.2% in 1QFY10.

Other income has risen 68.3%YoY to LKR182.9 mn in 1QFY11. RCL's other operating income has increased by 68.3%YoY to LKR182.9 mn during the quarter mainly owing to profit on sale of shares amounting to LKR164.7 mn.

Net profit has increased by 188.9% YoY to LKR382.5 mn in 1QFY11. RCL's finance cost has dipped by 55.2%YoY to LKR55.8 mn in 1QFY11 owing to circa 26%YoY reduction in borrowings totalling to LKR790.7 mn and low interest rates. Consequently, the net profit during 1QFY11 grew by 188.9%YoY to LKR382.5 mn.

Slow and steady growth in bath-ware. The new Bathware manufacturing plant that commenced commercial operations in FY09 (built at a cost of LKR1.2 bn) with an installed plant capacity of around 250,000 pieces per annum has contributed LKR101.5 mn in revenue during 1QFY11 vs LKR26.4 mn in 1QFY10. The sanitaryware has also reduced its losses to record a loss LKR5.8 mn vs a loss of LKR38.5 mn in the corresponding previous quarter. Further, we believe that with the management's efforts on entering into new contracts this manufacturing facility would breakeven in another 10 - 12 months whilst the company is also focusing on increasing exports of sanitaryware.

Further, the company plans to open around 4 to 5 new showrooms during this year mainly in the recently liberated North and East. Further, due to the increased demand the company is planning to increase the capacity of the Horana plant by circa 3,500 pieces by January 2010. Moreover, the company owns a 33 acres land in Kiriwaththuduwa (owned by its newly incorporated subsidiary, Rocell Ceramics Limited) and has an option to commission a brand new floor tile facility there if there is a need for further expansion.


Forecast net profit to grow by 63.8% YoY to LKR1,579.4 mn in FY11E. With the economic conditions improving and demand from both home builders and hotels and apartment towers picking up considerably and with the interest rates on the downward trend we revise our projected FY11E earnings upwards by 12.9% to reach LKR1,579.4 mn (up by 63%YoY). On top of the demand picking up in the country, the expected reconstruction boom in the North and East from drumming up the overall economic growth, the construction industry is expected to witness a turnaround. RCL is one of the prime beneficiaries as a leading player in the Western province and a dominant player in the country. With the company's short term plans to increase capacity in the existing production facilities (increase production by 3,500sqm at Horana by Jan'2011) we revise up our FY12E forecast also by 31% to LKR2,068.3 mn (up 31% YoY).

Share offers good value on 4.5X forecast FY12E earnings. Despite the share appreciating sharply since we initiated "BUY" recommendation on the counter, the share is still trading at steep discount to market and remains very attractive on just 5.9X FY11E net profit and 4.5X forecast FY12E net profit whilst trading at 1.4XPBV. Maintain - BUY
»»  read more

Saturday, July 17, 2010

Dipped Products PLC (DIPD) : Escalating rubber prices remains a major concern


Dipped Products PLC (DIPD) is the fully integrated and globally acknowledged rubber glove manufacturing arm of the local conglomerate Hayleys PLC (HAYL: LKR301.00). Currently DIPD exports its products to +68 countries and enjoys a 5% global market share for natural and synthetic latex based domestic and industrial gloves.

DIPD is globally ranked amongst the top three manufacturers of non-medical gloves whilst it ventured in to production of medical gloves in 2002 with a production facility in Thailand. At present DIPD operates seven production facilities in Sri Lanka and Thailand with marketing operations in Italy.

Despite the global recessionary pressures which hampered the demand for gloves, the company’s Thailand operation which is dedicated to produce medical gloves has posted a profit of LKR101 mn in FY2010 from a loss of LKR159 mn the previous year. At present all seven plants of DIPD are operating at near full capacity (which is at circa 85%). DIPD also manages the plantation arm of Hayleys group with two listed companies namely: Kelani Valley Plantations PLC (KVAL: LKR99) and Talawakelle Tea Estates PLC (TPL: LKR38.00). The company holds 71.67% in KVAL and 25% of TPL which produces around 5% of Sri Lankan tea and 4.5% of country’s rubber with +19,500 ha.

Further, KVAL sells 25% of its produce to its parent DIPD whilst selling the balance at auctions. Going forward, with the increasing rubber prices resulted by recovering global activity levels we believe KVAL will strengthen the bottom line of DIPD.

Therefore, we forecast KVAL to post a net profit of LKR245 mn in 2010E and to grow by a further 15% YoY in 2011E. Further during FY2010, DIPD acquired one third of Hayleys Plantation Services; the holding company of TPL for a consideration of LKR280 mn. Being one of the high quality tea manufacturers in the country, this venture would also result in a positive push for the group’s bottom line (through associate income).

Future outlook 
The glove industry is a steadily growing industry in the world where medical glove category being the main growth catalyst backed by the necessities in healthcare and ever evolving medical technology sectors. Going forward it is estimated that global demand for gloves to be at circa 150 bn pieces in 2010 and to grow by a steady 8%-10% thereafter. The company plans to add another 50% to the current capacity of the Thailand Operation which is the sole medical glove facility of the group in FY2011E for an estimated investment cost USD5.6 mn. This will increase the production of the plant to 855 mn medical gloves per annum by the end of FY2011, which is inline with the high growth potential of the medical glove segment. Out of the total investment 30% would be equity funded by DIPD whilst the rest would be financed from bank borrowings. Backed by the additional capacity coupled with reliable and long lasting customer base in 68 countries we believe DIPD would post sustainable earnings growth in the years to come.

Fluctuating rubber prices could affect the company’s margins considerably and current escalating rubber prices in the global commodity exchanges remains a concern to the company as a near 50% of the cost of production comprises of latex sourcing costs. However, DIPD could wither the negative effects to a certain extent as they can pass the price hike to its customers.

Furthermore, weakening Euro amidst the financial crisis in European Union would also have negative impact on company earnings. It should be noted that additional capacity would add value to the earnings only from FY2012 (as all three production lines would commence operations by the end of FY2011) whereas borrowing costs would impact the bottom line of the company in the short term (with 70% of USD5.6 mn being funded from debt).

The management of DIPD is positive about its future and plans to implement lean production systems to all its plants with the objective of improving productivity. To minimize the energy costs the company has already taken measures to reduce dependency on fossil fuels where a few plants have bio mass heaters in place. The management also stated that the loss of GSP+ for Sri Lankan exports would not have a material effect on DIPD’s sales, as only 3% of its total production would fall in to GSP+ benefited category. In addition, the company’s continuous focus on new product development aiming especially the niche markets in the glove industry would enhance the sustainability of the earnings growth.

Forecast FY2011E earnings to record LKR723.7 mn. With the company’s expansion strategies to be implemented in Thailand operations (which would add another 50% to its current capacity during FY2011), continuous focus on new product development coupled with the much anticipated recovery of the global activity from the current downturn and healthy earnings from plantation arm (backed by escalating rubber prices and higher tea prices), we forecast the company to post a net profit of LKR723.7 mn in FY2011E (up 50.5% YoY) and reach LKR814.3 mn in FY2012E (up 12.5% YoY). Share offers good value trading on 10.5X FY2011E earnings.

The share currently trades on 10.5X forecast FY2011E net profits whilst trading at 9.4X projected FY2012E net earnings. Hence, backed by the enhanced capacities with focus towards further expansion, development of value added products coupled with better returns from the subsidiary on the back of high tea and rubber prices would strengthen DIPD’s bottom line in the future. Therefore we rate DIPD a BUY
»»  read more

Sunday, July 11, 2010

Sri Lanka Sierra Cables (SIRA): Signs of Recovery


Sierra Cables [SIRA : LKR3.70], together with its subsidiaries, is engaged in the manufacturing and sale of power and communication cables and various aluminum conductors for the domestic as well as international market (such as India, Australia, Dubai, Tanzania and Maldives). It is the parent company of the well reputed brand of ‘Alucop Cables’. SIRA holds around 20% share in the Sri Lankan electric cable market.

SIRA’s product range comprises of domestic cables as well as heavy cables. It is the heavy cable range which carries greater margins for SIRA with the main consumer being the Ceylon Electricity Board (CEB). CEB makes up around 40% of SIRA’s top line which varies according to the number of tenders awarded to them. Also, these heavy cables have little but strong competition with just 3 players in the market whilst competition for small domestic cables is more intense.

Of SIRA’s total cost structure, approximately 90% of the total cost encompasses the raw materials, copper and aluminium whilst PVC takes up around 2%-3%. Copper and aluminium is imported from India on a weekly basis and traded at London Metal Exchange (LME) spot prices whilst PVC is purchased from Singapore and Malaysia. The graph below shows the price movements of these materials over a year:


Sales dipped 31.5% YoY in FY2010, as a result of the management’s hesitation to deliver stocks on credit to customers whose purchasing power was crippled during the financial turmoil in 2009.

Also, SIRA has terminated its manufacture of enameled winding wires as the product did not perform to their expectations. Though the top line was eroded, the company has recorded a favorable move in gross profit margins from 15.2% to 21.2%, thus restoring SIRA’s financial stability in FY2010. This was a result of the management procurement policy in purchasing raw materials on a WoW basis and thus is prone to minute price fluctuations than other risky attempts.

The investment in energy efficient machinery last year also contributed to the company’s production efficiency strategies shrinking energy cost from LKR2.4 per kg to LKR1.65 per kg this year.

The overall administration costs fell by 15.1% YoY leading to an operating profit of LKR115.6 mn with a 3% YoY increment elevating the Operating profit margins by 3.7% YoY to 11.1%. Other income owed vastly to support SIRA record a healthy bottom line despite the dip in the top line.

Other income recorded a 34.8% YoY increase on the back of a gain of LKR34.6 mn made on the disposal of the 20.3% stake in their associate- Central Industries [CIND : LKR250]. SIRA now holds 16.8% in CIND as at 31.03.2010.

Future Potential Early 2010, SIRA took a diversified move to invest around LKR250 mn (of which LKR100 mn was funded through commercial loans) in hydro power stations in the Central Province of Sri Lanka through its 100% owned subsidiary, ‘ Sierra Power’, which holds 93% of this investment.

The intent of the strategy was to merge strongly with the energy industry of the nation. The management expects to add the output to the national grid in another two years time. Also, the company plans to produce value added products such as wire harnesses for auto mobile as they believe these value added products would yield better margins.

SIRA is in the process of negotiating with an European car manufacturer to supply their new product range of automobile wires which is being delayed as a result of the air financial crisis. Also, similar discussions continue on a tie up with a Norwegian cable manufacturer. As per the publication of Central Bank of Sri Lanka, the construction industry had grown by 8.5% YoY during 1Q2010 in comparison to equally high growth rates witnessed in 2006 and 2007 after recording a mere 3% YoY growth n 1Q2009.

According the 2010 mini budget, the Nation Building Tax of LKR16.9 bn would be invested in the rehabilitation and reconstruction programme in 2010. The budget also highlighted that around LKR13 bn was spent on the road network projects during January-April 2010 whilst power, port, irrigation, water, resumption of private sector initiatives on urban development projects also absorbed in heavy investments.

SIRA has shown signs of recovery after reporting an upturn of 31.05% YoY in FY2010.The company is taking optimistic moves in having their market penetration and product development strategies in play coupled with the footing in the hydro generation. With unconfirmed tenders from CEB and after taking into account the positive outlay by the construction industry at large with no drastic adverse moves in the global copper prices, we expect SIRA to exhibit a 63.7% YoY growth in earnings to LKR177.1 mn in FY2011E with a P/E of 11.2X whilst reporting LKR263.6 mn in FY2012E (up by 48.9%) and trading on a P/E of 7.5X FY2012E earnings.
»»  read more

Thursday, July 8, 2010

Chemical Industries (CIC) : FY10 earnings driven by agriculture sector


Originally set-up as a Trading House for ICI - UK, Chemical Industries Colombo (CIC) has pursued a policy of planned growth which has resulted in its diversification into a number of fields over the years. The company grew into agriculture, paints, pharmaceuticals, industrial raw material and packaging dwarfing the chemical business.

CIC Agri Businesses, the biggest contributor in terms of revenue and earnings to the group (near 70%), comprises of companies that provide inputs to the agricultural sector. The construction sector is effectively CIC's paints and surface coatings business (includes the flagship brand Dulux) which is under the group's associate Akzo Nobel Paints Lanka. CIC's quoted subsidiary Chemanex is a manufacturer and marketer of chemicals and industrial intermediates. The pharmaceutical business markets products from principals like Johnson & Johnson, Hilton Pharma and Solvay Pharmaceuticals and sells products from prescription drugs to diagnostic equipment to hospitals.

CIC reported a 47.4% YoY growth in net earnings to LKR600.9 mn during FY10 (greatly inline with our forecast of LKR583 mn) driven by the strong performance in 2HFY10.

CIC's FY10 profits have been driven predominantly by the key agriculture and livestock sector (EBIT up 50%YoY) coupled with 17.8%YoY increase in other income and improved contribution from the industrial raw material sector (EBITT up 92.4% YoY).

The consumer and pharmaceutical sector has weathered a challenging period where the EBIT contribution dipped 10.5% YoY whilst construction sector and packaging segments recorded healthy results to post 7.6% YoY and 12.3%YoY growth respectively during the year.


Quarterly performance at a glance
CIC's turnover grew by a modest 5.9% YoY to post LKR16,610.5 mn in FY10, driven by higher turnover in the key agriculture and livestock segment (up 7.5% YoY) mainly due to improved performance in the seed and livestock business. The paints segment (inputs to associate Akzo Nobel Paints Lanka) saw the top line dipping (down 21.4% YoY) due to the poor performance in 1HFY10 despite the previously cash strapped consumers gradually willing to spend on non essentials during 2HFY10. Revenue from consumer and pharmaceutical segment has grown by 11.4% YoY whilst that of industrial raw material grew by a mere 2.3% YoY due to the global economic downturn where demand for paints related raw materials, rubber and textile binder related materials was still sluggish. The packaging sector remained flat (up 0.5% YoY) signalling the improvement in the previously deteriorating market conditions.


Cost of sales (up 5.4% YoY to LKR13,247.1 mn) has also increased inline with the rise in turnover levels whilst Gross Profit increased by 8.0% YoY to LKR3,363.4 mn. Further, the gross margins have improved marginally to 20.2% in FY10 (vs 19.8% in FY09) due to the group’s efforts on retooling the value chain and efficient business model. With the turnaround seen in 3QFY10 after a poor first half the 4QFY10 too has shown improvement where the revenue has grown 6.2% YoY during the quarter whilst the gross profit has grown 12.4% to LKR893.2 mn

Consequently, despite a rise in administration expenses by 6.5% YoY to LKR1,301.4mn and distribution costs by 11.2% YoY to LKR997.8 mn, operating profit grew by an impressive 27% YoY to LKR1,060.9 mn mainly on the back of the foreign currency translation loss of LKR160 mn incurred in FY09. CIC’s main operational counters witnessed a significant growth in operating earnings where operating profit from the Agriculture segment grew 41.9% YoY to LKR740.6 mn whilst the Packaging sector posted LKR79.1 mn, up 12.3% YoY. The Industrial raw material sector grew by 92.4% YoY to LKR52.0 mn and Construction sector grew by 7.6% YoY to LKR58.3 mn whilst the Consumer and Pharmaceutical sector EBIT dipped 10.5% YoY to LKR215.6 mn despite the sector revenue growing by 11.4% YoY. This is mainly on the back of the pending commissions receivables in food trading.


The Other income has grown to LKR484.9 mn vs LKR411.5 mn posted in FY09 (includes the capital gains from the disposal of Commercial Leasing and Dev-Fern Ltd) mainly due to LKR250 mn released by the government as subsidy payments for Fertilizer sales during November’08 - March’09.

CIC’s share of profit from associates has dipped 19.6% YoY to LKR212.6 mn in FY10 on the back of the dip in profitability of paints sector (Akzo Nobel Paints Lanka). Overall, CIC’s EBIT has witnessed a growth of 16.4% YoY to reach LKR1,758.5 mn in FY10.

Finance cost during the year dipped by 8.6%YoY to LKR671.8 mn mainly on the back of dip in interest rates. Subsequently, the Profit Before Tax has increased by 39.9% YoY to LKR1,086.6 mn in FY10. FY10 net earnings have reported a sharp 47.4% YoY increase to reach LKR600.9 mn where net margins are at 3.6% in FY10 compared to 2.6% in FY09.

Agri business to propel growth?
CIC Agri Businesses, the biggest contributor in terms of revenue and earnings to the group (circa 70%), weathered a challenging first half where the off take in crops was slow however with improved sales and receipt of pending subsidy payments in 2HFY10 the sector contributed positively in FY10. Looking ahead, revival in agriculture is expected to propel earnings growth in the future. Whilst agribusiness remains the company’s key sector, CIC has acted to diverse its agri-revenue streams thereby reducing exposure to weather shocks. CIC is positioned to successfully reap benefits from the changing macro environment of the country where we believe the company is to benefit significantly from an anticipated revival in the agribusiness sector specially stemming from the previously war torn North. CIC has already made its business move into the Eastern province with two large dairy farms. However, venturing in the dry zone is taking more time to break even than expected. But we believe with CIC’s efforts to manufacture for leading brands or developing their own brands would take at least another two years to breakeven. The expansion projects in the sector (banana export project in the Eastern Province, 2,200 acre large scale dairy complex at Mutuwalla in East, Rice exports, etc) would be an added bonus, once the benefits materialize.

Further, forward integration into food retail is also on the cards for CIC however according to the company nothing concrete has been tabled. With the much anticipated economic integration of the previously war affected North & East and the untapped potential in these areas along with an extension to its out grower network we believe CIC agri business is prime to benefit in future.

The Construction business is effectively CIC’s paints and surface coatings business which comes under the group’s associate company Akzo Nobel Paints. CIC is into decorative, vehicle refinishing and industrial paints segments where 80% of the revenue comes from the decorative sector. CIC has a near 40% market share with paints under the brand names such as Dulux and Glidden targeting different income levels. The paints and coatings business had a turbulent period with circa 5% to 10% volume dip due to harsh market conditions. However, once fresh investments, rehabilitation activities and infrastructure developments commence in the North and East there would be an enormous scope for growth.

The Consumer & Pharmaceutical and Industrial Raw Material businesses are also expected to witness a turnaround in FY11 with improved global economic environment.


Forecast FY11E net profit to rise 26.5% YoY to LKR760.2 mn. On the back of improving economic conditions, benefits from the North& East and anticipated payoffs from the new projects especially in the food trading, industrial raw material and seed business we forecast CIC to post LKR760.2 mn (up 26.5% YoY) in FY11E and LKR947.9 mn (up 24.7% YoY) in FY12E.

The voting counter has gained 14.4% YTD whilst the non-voting counter has gained 17.3% YTD against a market gain of 25.2%. Following the end of the three decade old war (18th May 2009) the broader market gained an impressive 95.3% whilst CIC (voting) has gained 87% and CIC (non voting) has gained 74.3%.

The voting counter trades at 8.7x FY11E earnings (7.0x FY12E) and the non-voting counter trades at 5.8x FY12E earnings (4.7x FY12E) whilst trading at discount to market.

We believe domestic growth would be observed from the vast potential in the North & East especially in the agriculture and paints sectors where CIC is positioned to successfully reap benefits. On the back of prospects of steady growth (through company’s strategy of balancing the business portfolio between agriculture and non agriculture segments) along with growth stemming from agriculture in the long term and untapped potential in the North & East, we believe both the voting and non voting counters still offer substantial value.

However, CIC’s vast exposure to agriculture and especially fertilizer business makes the company’s quarterly performance unstable. We believe the heavy rains during the first two months of 1QFY11 (however according to the company there has not been a notable reduction in sales so far) and the still to recover paints business could have an impact on the first quarter performance. Despite the short term vulnerability in earnings due to the potential in the long term and attractive earnings multiples we rate CIC a Long Term BUY.
»»  read more

Sunday, July 4, 2010

Plantation Earnings…End of lull?


Sri Lankan plantation sector as a whole saw positive earnings during the last two quarters ending its earnings lull due to peaked tea prices (which is now consolidating) and escalating rubber prices. The sector which comprises of 18 listed companies posted net earnings of LKR1,937.8 mn in 2010/FY2010 recording an impressive two-fold growth whilst the last quarter (which is 4QFY10/1Q2010 ended 31st March 2010) saw earnings worth of LKR LKR1,313.7 mn versus a loss of LKR391 mn in the corresponding period previous year.

Sri Lankan tea prices marked a strong recovery mid 2009 onwards where it touched the highest ever prices in mid September which was recorded at LKR456 per kg (up 70% YTD) owing to the low supply from Kenya and India due to unfavourable weather conditions. Sri Lanka too faced adverse weather patterns and produced only a national output of 290mn Kg (down 9% YoY) in 2009.

Consequently the Net sales average (NSA) for tea rose to LKR361 per Kg in 2009 from LKR301.6 per Kg in 2008. However going forward, with the recovery of global production (tea output up by 75% YoY in Kenya and 12% YoY in India during the first 4 months of the year) along with increase in Sri Lankan tea output (up by 30% YoY to 102.3mn Kgs in Jan - Apr 2010) we expect the prices to consolidate at current levels and pick up from mid July onwards and reach LKR375 per kg by the end of 2010.

Cost of production (COP) of tea increased by a sharp 17.1% YoY in 2009 due to the 40% increase in estate labour wages. The two year termed collective agreement on wages expired in April 2009 and daily wage of estate labour was revised from LKR290 to LKR405 resulting +LKR60 mn additional wage cost per month and a near LKR80-100 mn increase in gratuity provisioning for the year, for each plantation company. We forecast national average COP to rise to LKR330 in 2010 on the back of increasing fertilizer and energy prices with the global activity levels picking up.


With current tea prices at LKR340 per Kg (down 5.8% from average NSA for 2009), we anticipate that the Sri Lankan tea business would see marginal profits in 1QFY2011/2Q2010. However, with the prices picking up from mid July 2010 onwards (starting of Russian winter buying and lower production in Kenya due to colder weather) we expect the gross margins of tea to improve from 1H2010, which would sustain the profitability.

Sri Lankan rubber prices which recorded the lowest in December 2008 reached all time high levels in June 2010 due to global shortfall in production coupled with the gradual recovery of global activity levels from recessionary pressures. Further, with the increase in crude oil prices, making synthetic rubber (which is made out of crude oil) more expensive, natural rubber producers are expected to enjoy high prices in the short term. Prices of Ribbed Smoke Sheets (RSS1) in local auctions increased by +30% YTD during the first six months of 2010 whilst Crepe prices rose by 59% YTD. However with the increased production coming from major rubber producing nations in the coming quarters we anticipate the rubber prices in the global exchanges to consolidate by the end of 2010. We expect NSA of rubber to reach LKR320 per Kg in 2010, up by a sharp
50% from LKR211.6 per Kg in 2009.

COP of rubber too increased to LKR118.4 per Kg in 2009 owing to the 40% increase in wages. Going forward, with increasing fertilizer and energy costs on the back of rising global activity levels and stable estate wages we project a COP of LKR124 per kg for rubber (marginally up 4% YoY) in 2010.

Going forward, with increasing rubber prices and stable cost of production Sri Lankan plantation companies which has exposure to rubber would secure healthy profits in coming quarters.

»»  read more

Wednesday, June 30, 2010

Budget Overview - 2010

  • High current expenditure of LKR879.6bn together with poor revenue collection lead to an overall budget deficit of 476.4bn (9.9% of GDP) in 2009.
  • Projected revenue growth for 2010 is somewhat ambitious 15.8% to LKR841.0 bn, with expenses projected to increase by a slower 6.5% largely due to slower escalation in recurrent expenditure.
  • With the improvement in projected revenue growth and manageable level of recurrent expenditure government expects the budget deficit as a percentage of GDP to be maintained at 8% (downby 2% YoY). Further deficit is expected to be financed using 28% foreign financing and 72% using domestic borrowings.
  • The budget deficit during the first four months of 2010 curtailed at 3.1% as a percentage of GDP.
  • The “mini” budget presented did not have any revised revenue proposals and the 2011 budget that will be presented in November 2010 is expected to propose more detailed policy initiatives.
Deficit target of 8.0% of GDP in 2010, ambitious yet achievable
The United Peoples Freedom Alliance (UPFA) government presented its sixth consecutive fiscal budget in parliament on 29th June 2010 for the remaining six months of the year. Further this would be the fifth budget paper presented under the “Mahinda Chinthanaya” programme, following the current President taking up office in 2005.

The 2010 “mini” budget was presented with the wake of IMF’s third tranche of USD407.8 mn being disbursed, which considerably strengthened the government’s coffers. Despite the circa LKR1 bn reduction on expenditure for defense and public security and LKR17 bn reduction on other goods and services mainly due to the drop in such expenditure on national security, the Recurrent Expenses are expected to increase
by 5.5% to LKR928.3 bn mainly due to expected increases in salaries and wages, interest expenditure and subsidies and transfers. The total expenditure is expected to grow by 6.5% to LKR1,279.8 bn whilst total Revenue (excluding grants) is expected to grow at a faster 16.9% to LKR817.8 bn (including grants 15.9% growth to LKR840.9 bn), capping the target deficit at 8.0% of projected GDP. However a 15% plus growth
in revenue could be an uphill task given the current tax regime nevertheless a 24.6% growth seen in the first five months of the year is an assuring factor. Further, Jan-April 2010 has recorded a budget deficit of 3.1% vs 4.1% recorded in the same period in 2009.

The “mini” budget presented did not have any revised revenue proposals and the 2011 budget that will be presented in November 2010 is expected to propose more detailed policy initiatives.


Poor revenue collection and increased spending Divert Deficit target in 2009
IMF deal extended in view of better fiscal management. International Monetary Fund has released funds worth USD407.8mn today which was discontinued following the last year's budget diversion from the expected deficit of 6.5% of GDP to 9.9% due to increased spending and poor revenue collection over the period. The amount was released on the assurance of a more responsible fiscal management for the coming
year. Even though the capital expenditure was 10.9% lower than projected amount , the high current expenditure of LKR879.6bn together with the 10.2% lower revenue lead to an overall budget deficit of 476.4bn (9.9% of GDP) whilst the growth in revenue was circa 5.7%YoY

Revenue targets fell short by 10.2% in 2009. The government has fallen behind its original revenue target of LKR855.0 bn largely owing to slow down in collection of tax revenue which was attributable to the decline in international trade related taxes and reduced domestic economic activities coupled with global economic recession. The high inflationary scenario has had a negative impact on consumption growth, leading to a VAT collection of LKR185.7 bn (lower than the original estimate of LKR221.9 bn). Further the revised value of LKR149.7 bn in 2009 has fallen behind the projected income tax collections of LKR166.7 bn (up 11.4 % YoY).

Recurrent expenditure has overshot target by 6.8% in 2009. The revised recurrent expenses for 2009 was LKR879.6 bn vs the budgeted figure of LKR823.5 bn (up 6.8%) YoY. Increase in salaries & wages, pension payments, interest payments, counter terrorism activities, provision of humanitarian facilities for IDPs and resettlement activities in conflict affected areas drove the recurrent expenses higher than budgeted. Further revised recurrent expenditure as a percentage of GDP stood at 18.2% vs 15.8% which was budgeted in 2009.

Capital expenditure continues to be the scapegoat. Capital spending has been curtailed at LKR330.5 bn (still up 30.9 % YoY), 10.9% lower than the original estimate in 2009. Despite the government's emphasis on infrastructure development, spending on highways and ports following the war have been lower than expected.

Both Domestic and Foreign borrowings to bridged the deficit. Domestic financing contributed 82.2% whilst Foreign financing contributed 17.6% to finance the overall budget deficit of LKR476.4bn. Foreign financing soared to LKR 83.9bn (plus 45% YoY higher than the estimate) whilst the domestic financing dipped by 24.9% YoY to LKR 392.5.6bn (yet 114.3% higher than the forecasted).

Fiscal position to improve in 2010
Revenue projected to grow by 15.9% YoY in 2010. The target of 15.9% YoY growth in revenue to LKR840.9 bn is somewhat ambitious where the total revenue collected for the period Jan-May’10 the has been LKR298.2 bn. The “mini” budget has not proposed any new revenue proposals where the more detailed policy initiatives would be proposed in the 2011 budget Nov 2010. The total revenue is estimated to be generated from LKR729 bn tax revenue and LKR88.8 bn non-tax revenue. Whilst the government
estimates the taxes from external trade to rise 14.0% YoY to LKR145.2 bn, mainly on the back of increase in imports, the Jan-May’10 figures show a 14.2% YoY dip on the back of the Government scaling down certain duties.

Further, the recently proposed tax reforms on imported vehicles, raw materials, electronic goods and etc could also hinder the revenue stream despite the expected increase in the number of items imported. The government expects to meet the revenue target mainly through 14.9% YoY growth in income tax, 20.3% YoY growth in taxes on Goods and services and 14.0% YoY growth in taxes on external trade. Further, the improved domestic economic activities and increase in imports are expected to shoulder the revenue growth.


Total government expenditure for 2010 is estimated at LKR1,279.8 bn. Total government expenditure for 2010 will comprise of LKR928.3 bn (up 5.5% YoY) recurrent expenses and LKR352.5 bn capital expenditure. However the overall government spending for the first four months of 2010 stood at LKR410.9 bn which leaves the government with LKR868.9 bn for the remaining period of 2010.

Recurrent expenditure expected to rise by only 5.5% YoY in 2010. Government expects recurrent expenditure to rise only by 5.5% YoY to LKR928.3 bn in 2010 largely on account of falling inflation levels. However interest cost (which constitutes 36% of recurrent expenditure) is expected to be the main driver of expenditure growth rising 8.9% YoY to LKR337.2 bn in 2010.

Further salaries and wages which accounts for circa 32% of total recurrent expenditure will be increased 9.4% YoY to LKR296.7 bn in the budget 2010. From salaries and wages 47% will be paid to national security and 36% is for education & health.

Subsidies and transfers which account for 22% of recurrent expenditure will be increased 6.7% YoY to LKR202.9 bn whilst pension to public servants would account for nearly 46% of the total subsidy payments.


The total defence and public security expenditure is projected to be at LKR186.3 bn compared to LKR187.2 bn (reduction of mere 0.5%). However we see a considerable reduction in other goods and services estimates from LKR108.5 bn in 2009 to LKR91.5 bn (down 18.6% YoY) largely due to reductions in expenditure on national security.

Further it should be noted that the government has utilized LKR327.0 bn as recurrent expenditure during the first four months of 2010 from the budgeted figure of LKR928.3 bn for 2010.


Capital expenditure is projected to rise by 12.1% YoY in 2010. Government expects a 12.1% YoY rise in capital spending to LKR 361.5bn in 2010 where the main focus is on road development which constitutes 23% of total capital expenditure. Further 10% of non recurrent expenses will be directed towards water & irrigation infrastructure whilst 11% is for the improvement in education & health system in the country. During the period Jan-April 2010 government has only spent LKR89.1 bn from the total budgeted
amount leaving another which leaves them with LKR272.4 bn for development activities for the 2H2010.


Foreign financing to rise in 2010. The government would rely on both foreign and domestic financing to service the planned fiscal deficit of LKR438.8 bn. The government plans to increase its total foreign borrowings by 47.2% YoY to LKR123.5 bn which are largely committed funds. The bulk of the deficit would be financed by domestic borrowing of LKR315.3 bn which would be at a dip of 24.5% YoY. As the proposed budget outturn indicates a reduction in domestic financing by LKR77.1 bn, the government
expects pressure on interest rate to ease which would facilitate credit expansion for private sector development


General benefits of budget 2010

Infrastructure:
Road network: The government has allocated LKR83.4 bn, which is 23% of the total capital expenditure budget for the development of highways. 530 km of rehabilitated national roads, 300 km of rehabilitated provincial roads and 34 new bridges would be added to the road network in 2010. Further, 181 km of express ways, 104 bridges and 1,500 km national roads would be upgraded during the next 3 years.

Port and Aviation: A total of LKR30 bn has been provided for the development of port and aviation facilities where the main projects would be Colombo port expansion, Hambanthota Port development and the construction of the new airport in Maththala.

Irrigation and Water management: It has been proposed to invest LKR37 bn in irrigation and water management systems which include construction of Moragakanda dam and irrigation system, Uma Oya diversion project, Deduru Oya etc. These projects are expected to bring additional area of land under irrigation and convert many lagging districts into economically prosperous areas during next six years.

Terrorist conflict affected areas: A comprehensive medium to long term reconstruction strategy has been planned to transform conflict affected areas into decent living conditions. Funding arrangements are already in place to implement transport, electricity, water, schools, healthcare and all essential facilities in the areas.

Public services:
Health and Education: A total of LKR40.8 bn has been allocated to ensure a quality healthcare system and an education system in the country. Out of that LKR13,300 mn is to be spent on supplying drugs and pharmaceuticals to government health care centers in assuring free healthcare to the nation. Further, a national policy on nursing services will be introduced to improve quality of service whilst indigenous medicine would be popularized as a supplementary health service.

The government proposes to build partnerships with private sector to facilitate students who do not get placement in local universities due to limited openings. This would open more opportunities to the students whilst saving foreign exchange spent on education abroad.

Transport: LKR6,650 mn has been set aside to meet expenditure on subsidized railway and road transportation in 2010.

Water & Electricity: 100,000 new water connections and 250,000 new electricity connections are planned for 2010. This would be augmented to 150,000 water connections and 300,000 electricity connections per year 2011 onwards.

Welfare and social safety: Proposed assistance to the poorer segments of the society, displaced persons, nutritional intervention programs and enhancement of school education exceeds LKR164,000 mn for 2010.


Recent Tax Reforms
There has not been any tax revisions in the mini budget proposed. Following are some recent tax reforms :
  • Vehicles : A general 50% reduction of duties on imported vehicles. The tax revision on motor vehicles with effect from 1st June 2010 is as follows :
  • Also, an overall removal of 15% surcharge on custom duty, resulting in a four band custom duty structure of 0%, 5%, 15% and 30% was seen with the tariff revision.
  • Imported raw materials/ machines and electronic items : A 3% reduction in duty on imported raw materials/ machines to 8% from 11%. Electronic items such as cameras and watches are now prone to a deduction below 10% of overall taxes and are only liable to Port tax levy and Nation Building Tax and not Cess or VAT.
  • Wheat Flour : Consequent to the withdrawal of tax concessions on wheat flour, the price of wheat flour increased by LKR10.5 per kg from 22nd June 2010 onwards.
  • Sugar, Liquor & Tobacco : Taxation on imported sugar increased by LKR5.0 per kg. Taxes on cigarettes also moved up by LKR1.0 per stick whilst taxes levied on a proof litre of spirits hiked by LKR50.0. These tax impositions came into force from 24th June 2010 onwards.
  • Value Added Tax
  • Port and Airport Development Levy


»»  read more

Thursday, June 24, 2010

Odel Unlimited (ODEL) Initial Public Offering


Odel Unlimited (ODEL), one of the nation's largest fashion, apparel and cosmetics retailers announced its IPO of 16.7 mn shares at LKR15.00 per share, expecting to raise LKR250.5 mn in total. The proceeds of the issue is planned to be partly utilized to support the expansion of branch net work (LKR150.5 mn) of the company and the rest (LKR100 mn) would be employed to settle part of outstanding loans.

The Company focuses on delivering maximum fashion and value to its shoppers by offering compelling selections. Odel stores offer a broad selection of merchandise and feature products from both local and exclusive international brand sources. The Company operates 12 stores spanning within the three districts of the Western Province and plans to open three more stores during the year 2010 (possibly in Wattala, Battaramulla and Kandy).

Odel's flagship store boasts of an average footfall of plus 1,500 per day (3,000 per day in the weekend) and a conversion rate of +90% whilst other branch stores also demonstrate above average footfalls and conversion rates though relatively lower than that of the flagship store.

Nonetheless Odel's cautious branch expansion efforts have made them to break even at the first month of operations itself. Given the uptrend in revenue stream and the company's emphasis on retiring debt capital we project net profit to grow by a three year CAGR of circa 27% during 2011E- 2014E.

In terms of earnings based valuations the share is attractive valued on 11.5X forecast FY11 net profit (based on the issue price of LKR15.00 per share) which is at a plus 20% discount to the forward market earnings multiple.

Further on a free cash flow to the firm (FCFF) valuation, intrinsic value per share is circa LKR18.00 (given a cost of capital rate of 18%) and remains attractive at the issue price of LKR15.00.

Based on both valuations the share generates good value at the issue price of LKR15.00. Further Odel IPO would be an opportune window for adventurers to capitalize on short term gains and to benefit in the medium term with the aggressive expansion driven organic growth of the company. Therefore strong upside for the share could be expected with steady income streams and Odel’s brand image coupled with strong investor appetite for IPOs, thus we recommend SUBSCRIBE

Industry Overview and Future Outlook
As a department store, Odel offers a wide range of product categories and operates across major segments of the Sri Lankan premium non-food retail industry. Except for the flagship outlet, the other stores generally focus on the premium clothing and footwear retail industry.

The country’s clothing and footwear industry is highly competitive as Sri Lanka being a major garment manufacturing nation. Low and middle level markets are spearheaded by clothing store chains such as “No Limit”, “House of Fashion” and “Fashion Bug” with stores Island wide. A high number of counter freight clothing items of premium brands are also visible in the country at a low price.

Odel has demonstrated strong performance where its top line grew at a four year CAGR of circa 11%. ODEL has reported a revenue of LKR2,416.8 mn in FY10, up circa 24% YoY. The growth in revenue is attributable to the aggressive expansion programme, improvement in per capita consumption and the increase in influx of tourists with the end of the three decade old war.

Revenue Trend
Subsequent to the strong spurt of growth in revenue the Operating profit has grown by circa 34% YoY to LKR208.2 mn in FY10. Further the EBITDA has been growing at an impressive four year CAGR of circa 26% with overheads being kept intact over the last five years.

In particular in FY10 EBITDA has surged by 68% YoY to LKR336.9 mn. Further the EBITDA margin has improved to 14% in FY10 from 10% in FY09 on the back of the capital gain of circa LKR75.6 mn made in FY10.

EBITDA vs EBITDA Margin Revenue: Cost Structure NPAT has grown by a tremendous three folds in FY10 on the back of the improvement in EBITDA and the reduction in finance costs. Even if the capital gain is removed the NPAT has marked a growth of 100% YoY in FY10.


Comparatively the Sri Lankan premium clothing and footwear industry is dominated by few players in the market of which Odel enjoys a sizable market share. Dilly’s Distinct and Cotton Collection cater to the same market segment as Odel although the product spread is rather limited as they focus mainly on premium clothing retail.

As a multi category retailer Odel contends with a broad range of competitors, not only limiting to the premium clothing retailers. Sri Lankan malls such as Crescat, menswear outlets such as Hameedias and sports outlets such as Reebok and Nike too competes with Odel in the respective fields.


The increased tourist influx following the three decade old war would have a positive impact on Odel as the company is renowned as “the tourist shopping destination in Sri Lanka”. Recovery in the economy brought about higher consumer sentiment driven by confidence in the market along with the reduction in unemployment. Thus with the disposable income on the rise local consumers tend to have a higher demand towards premium quality products.

Odel’s market positioning as a premium department store is a competitive advantage with a lower substitutability and a few number of competitors. With the expansions which are currently carried out, Odel expands its reach and would have access to a bigger market without dilusion.

The company’s own brand which yields a higher margin is mainly sold via the outlets in the Colombo suburbs. With the store expansion taking place the contribution from the own brands (at present the contribution is circa 20-30% of the top line) is expected to increase.

Valuations
Revenue is expected to increase at three year CAGR of circa 13% from FY11E to FY14E mainly on the back of improvement in consumption, growth in tourist arrivals to the country and better market reach via expansion of the branch network.


We expect the operating costs would grow at a three year CAGR of circa 13% from FY11E to FY14E slightly above the historical growth momentum. However we expect the OPEX to income ratio to reduce to circa 90% over the next four years from its current +95% levels due to revenue growth outpacing the OPEX growth.

As at 31st March 2010 the company has a debt of approximately LKR550 mn (Short and Long Term borrowings) with an interest cost of plus LKR70 mn. Odel is planning to retire part of its debt during FY11E using part of the funds (circa LKR100 mn) raised by the IPO. This would give rise to savings on interest costs from FY11 onwards without disturbing the cash position of the company. However we believe the company would resort to working capital loans and overdrafts to fund the short term funding requirements. Further it should be noted that the company would make its gearing position healthier by reducing the debt to equity ratio to less than 5% from its current 47%.

Given the uptrend in revenue stream and the company’s emphasis on retiring debt capital we project net profit to grow by a 3 year CAGR of 20% during 2011E – 2014E.

In terms of earnings based valuations the share is attractive valued on 11.5X forecast FY11 net profit (based on the issue price of LKR15.00 per share) which is at a plus 20% discount to the forward market earnings multiple.

Further on a free cash flow to the firm (FCFF) valuation, intrinsic value per share is circa LKR18.00 (given a cost of capital rate of 18%) and remains attractive at the issue price of LKR15.00. Based on both valuations the share generates good value at the issue price of LKR15.00. Further Odel IPO would be an opportune window for adventurers to capitalize on short term gains and to benefit in the medium term with the aggressive expansion driven organic growth of the company. Therefore strong upside for the share could be expected with steady income streams and Odel’s brand image coupled with strong investor appetite for IPOs thus we recommend SUBSCRIBE.
»»  read more