Sri Lanka Equity Analytics

We are a team of professionals with many years of experience and expertise in the equity and capital market of Sri Lanka. Voice: +1 (206) 426 1561

Get The Latest News

Sign up to receive latest news

Showing posts with label bank. Show all posts

Monday, August 16, 2010

Hatton National Bank (HNB) net profit up 23% YoY in 2Q2010


Hatton National Bank's (HNB) net profit has grown 23% YoY to LKR1,220.3 mn in 2Q2010 mainly on the back of a 7% YoY increase in net interest income, 25% YoY increase in non interest income and a 94% YoY reduction in provisioning cost which enabled 1H2010 net profit to grow by 10% YoY to LKR1,888.5 mn. With the economy expected to grow by circa 6%-7% during the next few years and contributions from the previously war affected North and East to the main stream economy the banking sector outlook remains positive with loan growth (grew 2.2% YoY in May) expected to gather momentum from 2H2010 with the low interest rate environment. HNB's net interest margins are expected to be intact at around 5%, whilst continuing to benefit from the wider reach facilitated by 189 branches (20 branches in the North and East) and higher retail focus.

However, we maintain our forecast 2010E net profit at LKR4,101.0 mn (down 9% YoY)with slower credit growth in 1Q2010 than anticipated coupled with high operating costs and projected 2011E net earnings at LKR4,547.8 mn (up 11% YoY).

The voting share is fairly valued at 17.0x forecasted 2010E profit and 15.3x on forecast 2011E whilst trading 2.4x PBV. The non voting share remains attractive on 11.0x forecast 2010E net profit and 10.0x projected 2011E net earnings whilst 1.5x PBV. Maintain BUY.


Interest income has dipped 16% YoY to LKR7,576.7 mn in 2Q2010. HNB’s interest income has dipped 15.6% YoY to LKR7,576.7 mn in 2Q2010, mainly due to a 19.4% YoY dip in interest income from loans and advances to LKR5,827.8 mn. The dip in interest income from loans and advances was on the back of low rates despite performing loans growing by 4.4% during the quarter to LKR164.2 bn. However interest income from fixed income securities remained flat at LKR1,748.8 mn even though treasury bill and bond portfolio (held to maturity) grew by 9.5% to LKR61.6 bn during the quarter which is approx. 21% of the banks’ total asset base.

Interest expenses dipped 31% YoY to LKR3,714.1 mn in 2Q2010. Group’s interest expenses have dipped 30.9% YoY to LKR3,714.1 mn in 2Q2010, on the back of 30.5% YoY drop in interest cost on deposits to LKR3,295.5 mn. The drop in deposit cost is largely attributable to low deposit rates and the shift in the deposit mix from high cost time deposits to low cost CASA products (CASA mix improved to circa 50% of total deposit base from 48% in 1Q2010). Further deposit base also recorded a marginal 1% growth to LKR216.4 bn during the quarter. Interest expenses on other interest bearing liabilities also dipped by 34.3% YoY to LKR418.7 mn.

Net interest income grew 7% YoY to LKR3,862.6 mn. The dip in interest income was off set by a faster decline in interest cost enabling net interest income to grow by 7.1% YoY to LKR3,862.6 during 2Q2010. Interest margins also improved to 5.3% (up 1.3% QoQ) in 2Q2010.

Non interest income grew 25% YoY to LKR2,000.6 mn in 2Q2010. Non interest income has grown by 24.8% YoY to LKR2,000.6 mn in 2Q2010 due to 31.6% YoY increase in other income to LKR1,764.1 mn. Other income growth was supported by the capital gains made by selling off shares it held in Commercial bank and Distilleries.

Foreign exchange income fell by 9.7% YoY to LKR236.5 mn, due to stagnant exchange rates.


Operating cost has increased by 13% YoY in 2Q2010 to LKR3,400.2 mn. Operating costs have risen by 12.6% YoY to LKR3,400.2 mn, mainly due to a 17.7% YoY increase in personnel costs to LKR1,283.4 mn. Increase in personnel cost was a result of salary revision undertaken across all staff grades of the bank during 2009. Consequently the operating cost per branch stands at LKR18.0 mn per quarter and the cost to income ratio is at circa 58%.

Provisioning cost has dipped 94% YoY to LKR 10.0 mn in 2Q2010. Total provisions have dipped 94.0% YoY to LKR10.0 mn, mainly due to a 160.0% YoY improvement in recoveries and 50.8% reduction in specific provisions. Gross NPL ratio for HNB is at 6.5% (compared to 7.4% in 1Q2010) and net NPL ratio stands at 3.3%. HNB’s non performing loans reduced by 8.0% to LKR13.4 bn during the quarter and the provision cover stood at 42%. (compared to 39% in 1Q2010).

Total tax bill has risen 13% YoY to LKR1,217.9 mn in 2Q2010. Value added tax (VAT) has increased by 19.5% YoY to LKR630.4 mn and corporate tax increased 7.1% to LKR587.5 mn pushing up the total tax bill (VAT and Corporate tax) by 13.2% YoY to LKR1,217.9 mn in 2Q2010. Thus the effective tax rate of the bank is near 50% in 2Q2010.

Net profit up 23% YoY to LKR1,233.1 mn in 2Q2010. Consequent to a 7% YoY increase in net interest income, 25% YoY increase in non interest income and a 94% YoY reduction in provisioning cost helped HNB’s profitability in 2Q2010. Cumulative 1H2010 profits also rose 10% YoY to LKR1,870.1 mn.

Forecast 2010E net profit maintained at LKR4,101.0 mn (Down 9% YoY). With the economy expected to grow by circa 6%-7% during the next few years and contributions from the previously war affected North and East to the main stream economy, the banking sector outlook remains positive where loan growth expected to gather momentum from 2H2010 onwards with the low interest rate environment. HNB’s net interest margins are expected to be intact at around 5%, whilst continuing to benefit from the wider reach facilitated by 189 branches (20 branches in the North and East) and higher retail focus (Retail mix is circa 60%).


However, we maintain our forecast 2010 net profit at LKR4,101.0 mn (down 9% YoY) with slower credit growth in 1Q2010 than anticipated (private sector credit growth in January 2010 was 0.6% MoM and 1.6% MoM in February 2010) coupled with high operating costs. However we expect 2011E net earnings to grow by 11% YoY to LKR4,547.8 mn on the back of loan book expansion (where the private sector credit is expected to grow from 2H2010 onwards) and cost rationalisation strategies expected to be adopted by the bank.

The voting share is fairly valued on 17.0x forecast 2010E net profit. The voting share is trading at 17.0x forecasted 2010E profit and 15.3x on forecasted 2011E whilst trading 2.4x PBV.

The non voting share remains attractive on 11.0x forecast 2010E net profit and 10.0x projected 2011E net earnings whilst 1.5x PBV. Given the stable macro economic outlook and expected credit growth HNB, is in a better position to reap the benefits out of it with its island wide coverage (has the largest presence in North and East). Further HNB’s new branches (specially in North and East) breaking even in the coming years will contribute positively to banks bottom line. Bank also has a divesified product portfolio where they aggressively look at growing areas such as foreign worker remittences, credit card business and pawning. Further we believe HNB would adopt necessary measures to curtail its costs with its newly adopted core banking system in the future. Thus we Maintain BUY.
»»  read more

Thursday, August 12, 2010

Nations Trust Bank (NTB) net profit up 86% YoY to LKR280.1 mn in 2Q2010


Nations Trust Bank's (NTB) net profit has grown by 86% YoY to LKR280.1 mn in 2Q2010, enabling 1H2010 cumulative net profit to grow by 49% to LKR494.2. Net profit in 2Q2010 grew mainly on the back of 32% YoY increase in net interest income and 55% YoY reduction in provisioning cost. With low interest rates and expected economic boom, banking sector outlook remains positive with loan growth (grew by 2.2% in May) expected to gather momentum from 2H2010 on-wards. Despite slower private sector credit growth NTB recoded circa 15% growth in performing loans from December 2009 where other banks recorded an average growth rate of 8-9%. NTB's net interest margin has improved to near 5.5% whilst the young and dynamic bank is set to grow in the coming years. We are maintaining our forecast 2010E net profit at LKR969.7 mn (up 41% YoY) and projected 2011E net earnings at LKR1,296.9 mn (up 34% YoY). Thus the share offers good value on 14.8x forecast 2010E net profit, 11.0x projected 2011E net earnings, 2.0x PBV. Maintain BUY.


Interest income has dipped 22% YoY to LKR2,541.2 in 2Q2010. NTB’s interest income has dipped 21.9% YoY to LKR2,541.2 mn in 2Q2010, caused by a 19.8% YoY dip in interest income on loans and advances to LKR1,581.1 mn and a 25.2% YoY dip in Interest income on other interest earning assets to LKR960.1 mn. The interest income on loans and advances have dipped despite the 6.4% YoY increase in performing loans during the quarter mainly on the back of low interest rates. Though the government securities portfolio (held to maturity) has remained flat the reduction in Treasury bill rates has impacted the income from fixed income securities negatively.

Interest Expenses has dipped 42% YoY to LKR1,389.0 mn in 2Q2010. Interest expenses has dipped 41.7% YoY to LKR1,389.0 mn mainly on the back of a 48.3% YoY dip in interest expense on other interest bearing liabilities as well as a drop of 33.4% YoY in interest expense on deposit. The interest cost was reduced with low deposit rates and shift in the deposit mix towards low cost
CASA products (CASA contribution improved to 29% from 27%). NTB’s deposit base also grew 4.1% during the quarter to LKR45.9 bn.

Net interest income has increased by 32% YoY to LKR1,152.2 mn in 2Q2010. Despite interest income having dipped by 22% YoY interest cost has dipped at a faster pace by 42% YoY enabling the net interest income to grow by 32% YoY to LKR1,152.2 mn.

Non interest income grew 6% YoY in 2Q2010. Non interest income has grown by 5.7% YoY to LKR477.0 mn in 2Q2010 due to gains made in forex earnings compared to losses suffered in the 2Q2009. However other operating income dipped 66.7% to LKR416.4 mn during 2Q2010.


Operating costs have increased 21% YoY in 2Q2010. Operating costs have increased 20.8% YoY to LKR892.4 mn, which was resulted by 85% YoY increase in personal costs to LKR408.0 mn which could be attributable to the increase in the number of employees. However premises, equipment and
establishment expenses have reduced by 10.1% YoY to LKR188.8 mn. However NTB’s cost to income ratio has improved to 55% from 57% as at 31st March.

Provision for bad and doubtful debts and loans has decreased by 55% YoY in 2Q2010. Provision for bad and doubtful debts and loans has decreased by 55.2% YoY to LKR90.6 mn, which was resulted by the 63.7% YoY decrease in specific-provision to LKR79.1 mn. Further NTB’s gross NPL ratio improved to 6.1% (7.0% in 1Q2010) and net NPL ratio to 3.2% (3.8% in 1Q2010).We believe NTB would be able to improve its NPL’s in the coming quarters with the improvement seen in recoveries.

Total tax bill has increased 57% YoY to LKR366.1 mn in 2Q2010. Value Added Taxation on banking income has increased by 72.6% YoY to LKR139.2 mn whilst tax on consolidated profit has also increased by 49.1% YoY to LKR226.9 mn which increased the total tax bill by 57% YoY to LKR366.1 mn in 2Q2010. Thus the effective tax rate in 2Q2010 is near 57%.

Net profit up 86% YoY to LKR280.1 mn in 2Q2010. Consequently a 32% YoY increase in net interest income and 55% YoY reduction in provisioning cost has pushed up NTB’s net profit by 86% YoY to LKR280.1 mn in 2Q2010.


Forecast 2010 net profit maintained at LKR969.7 mn (up 41% YoY). With the expected growth in the economy and low interest rate environment the banking sector outlook remains positive with loan growth (grew 2.2% in May) expected to gather momentum 2H2010 onwards. Despite slower private sector credit growth NTB recoded circa 15% growth in performing loans from December 2009 where other banks recorded an average growth rate of 8-9%. NTB’s net interest margins is expected to be intact at around 5%, whilst the young and dynamic bank is set to grow in the coming years. Therefore, we are maintaining our forecast 2010E net profit at LKR969.7 mn (up 41% YoY) and projected 2011E net earnings at LKR1,296.9 mn (up 34% YoY).

Share offers good value on 14.8x forecast 2010E net profit. The share offers good value on 14.8x forecast 2010E net profit, 11.0x projected 2011E net earnings, 2.0x PBV. Maintain BUY.
»»  read more

Tuesday, August 10, 2010

Sri Lanka - Sampath Bank (SAMP) 2Q2010 Net profit up 66%


SAMP's net profit increased 66% YoY during 2Q2010 mainly backed by improving core business activities (NII grew by 9.4% YoY) and capital gains realized from the sale of Lanka Bangla shares enabled the 1H2010 net profit to increase by 58.8% YoY to LKR1,344.5 mn.

With interest rates stabilizing (3 month treasury bill rate near 8%) and the private sector credit showing signs of growth (grew 2.2% YoY in May) which is expected to gather momentum during 2H2010 to record circa 10-12% growth by end 2010E, thus banking sector outlook remains positive. SAMP's net interest margins is expected to be intact at around 5%, whilst continuing to benefit from the wider reach facilitated by the current 149 branches coupled with its retail focus (nearly 60% retail exposure).

We are revising up our 2010E forecast by 2.6% to LKR2,457.0 mn (up 19% YoY) whilst maintaining our 2011E forecast at LKR2,698.4 mn (up 10% YoY). Thus the share offers good value on 11.2x forecasted 2010E earnings and 10.2x forecasted 2011E earnings whilst trading on 1.7x PBV. Maintain BUY


Interest income has reduced 17% YoY during 2Q2010 to LKR4,588.8. Interest income dropped 16.6% YoY during 2Q2010 due to a 13.1% YoY decrease in interest income from loans and advances to LKR 3,523.3mn and 26.2% YoY dip in interest income on other interest earning assets to LKR1,065.5 mn.

Interest income on loans and advances dipped despite a 2.5% growth in performing loans on the back of low interest rates. Government securities portfolio (held to maturity) dipped 56.3% during 2Q2010which was reflected in the reduction in interest income on other interest earning assets.

Interest expenses have dropped 30% YoY to LKR2,498.2 mn in 2Q2010. Interest expenses dropped 30.4% YoY in 2Q2010 mainly due to 27.1% YoY drop in interest expenses on deposits to LKR2,235.9 mn while interest expenses on other interest bearing liabilities also dropped 49.5% YoY to LKR262.3 mn. Total deposits increased 5.2% during the quarter to LKR 139.7 bn where low cost CASA deposits accounted for circa 46% (grew from near 44% during 1Q2010) of total deposits.

Net interest income has increased 9% YoY to LKR 2,090.6 mn. During 2Q2010, despite interest income dropping 16.6% YoY, interest costs dropped at a sharper pace of 30.4% YoY which resulted in the 9.4% YoY increase in net interest income.

Non interest income grew 71%YoY to LKR1,361.5 during 2Q2010. Non interest income grew 71.2% YoY mainly on the back of capital gain realized from selling off 1.2 mn shares (Due to this, Bank’s holding of 13.55% as at 31.12.2009 was reduced to 11.29% as at 30.06.2010) in Lanka Bangla Finance Ltd which boosted other income by 85.9% YoY.


Non interest expenses increased 15.7%YoY in 2Q2010 to LKR1,593.3 mn. Non interest expenses increased 15.7% YoY mainly due to 10.6% YoY increase in personnel cost to LKR673.2 mn and 13.5% YoY rise in overheads to LKR535.9. The increase in operating costs can be attributable to the expansions undertaken by the bank where it opened 6 new branches during 2Q2010. Further cost to income ratio stood at near 46% end of 2Q2010.

Provisions have increased 296% YoY in 2Q2010. Provisions have increased 296% YoY in 2Q2010 to LKR 322.4 mn largely owning to LKR255.0 mn specific provision on account of investment in Union Bank shares which increased total specific provisions to LKR669.5 mn. However recoveries have increased drastically during 2Q2010 by 239.1% YoY to LKR377.0 mn.

Operating profit has risen 27% YoY to LKR1,415.0 mn in 2Q2010. Operating profit rose 27.4% YoY during 2Q2010 to LKR1,415.0 mn backed by 9.4% YoY increase in net interest income and 71.2% increase in other income.

Total tax bill reduced 7% YoY to LKR 653.9mn. Total tax bill has reduced 6.9% in 2Q2010 due to 28.5% YoY decrease in corporate tax. However the VAT on Financial services has increased by 18.5%. The effective tax rate as at 30th June 2010 stood at 46%.

Net profit up 66% YoY to LKR746.1mn. SAMP’s net profit increased 66.1% during 2Q2010 mainly backed by improving core business activities (NII grew by 9.4% YoY) and capital gains realized from the sale of Lanka Bangla shares enabling the 1H2010 net profit to increase by 58.8% YoY to LKR1,344.5 mn.

Improved NPL ratios during 2Q2010. SAMP’s gross NPL ratio improved to 6.8% in 2Q2010 from 7.6% as at 31st December 2010 whilst net NPL ratio improved to 1.7% from 2.8%.

SAMP remains well capitalized. Tier I CAR stood at 11.1% (Tier I – Min 5%) whilst Tier II CAR was at 14.2% (Tier II – Min 10%) during 2Q2010.


Forecast 2010 net profit revised up by 2.6% to LKR2,457.0 mn (up 19% YoY). With interest rates stabilizing (3 month treasury bill rate near 8%) and the private sector credit showing signs of growth (grew 2.2% YoY in May) which is expected to gather momentum during 2H2010 to record circa 10-12% growth by end 2010E, thus banking sector outlook remains positive. SAMP’s net interest margin is expected to be intact at around 5%, whilst continuing to benefit from the wider reach facilitated by the current 149 branches coupled with its retail focus (nearly 60% retail focus).

Therefore we forecast 2010E net profit to grow by 19% YoY to LKR2,457.0 (revised up by 2.6%) and 2011E net profit to grow by 10% YoY to LKR2,698.4 mn. Share offers good value on 11.2x forecasted 2010E net profit. The share offers good value trading on 11.2x forecasted 2010E net profit and 10.2x forecasted 2011E net profit whilst trading on 1.7x PBV. Maintain BUY.
»»  read more

Tuesday, July 27, 2010

Sri Lanka Seylan Bank (SEYB) - Regaining Confidence...


Sri Lanka’s banking and financial services sector has been a steady contributor to the economy (10.3% to the GDP in 2009) and been one of the most sought after sectors in the Colombo bourse (that gained nearly 110% in terms of market capitalization and sector index gained near 124% during the year 2009). Going forward with the favorable economic outlook, growth potential of banks due to healthy capitalization levels and improving asset quality in the banking sector we see the sector performing above expectations in the coming years.

SEYB which was a one of the major player in the retail banking industry in the past is now showing signs of recovery after its set back in 2008 due to a run on the bank as a result of depositors losing confidence in the bank.

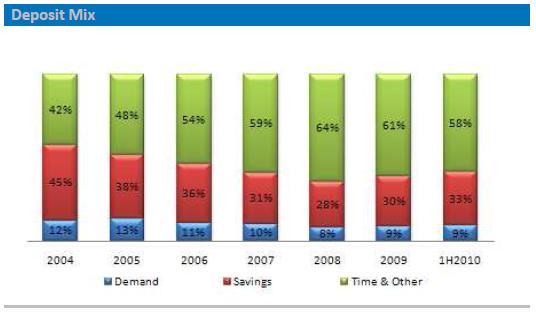
Deposits recoded a marginal 1.5% growth in 1H2010. Bank showing signs of recovering its lost deposits during 1H2010 where it recorded marginal growth after its steep decline in 2008. Further it is also encouraging to see a shift in the deposit mix more towards low cost current and savings (CASA) products. We believe SEYB would return to normalcy during the next 2 years recovering its deposits which would help them to grow from there onwards.

Improvement in non performing loans (NPLs) during 1H2010. NPL’s in 2009 peaked up to near LKR30.0 bn whilst the gross NPL ratio for 2009 stood at 29.3% (which was the highest in the industry). However with the emphasis on recovering the bad loans under new management we saw a reduction in NPL’s in 1H2010 which stood at LKR27.5 bn with the gross NPL ratio still being the highest in the industry at 25.6% (industry NPL ratio is circa 8%).

Healthy interest margins and capitalization levels. SEYB has always maintained its interest margins par with the sector due to its retail focus and differentiated service levels where the banks current interest margins stands at 5.5%. Further bank is also comfortably capitalized with in regulatory limits where the bank does not need to raise capital for its expansions in the near future.

Forecast 2010E earnings to rise by 78% YoY to LKR1,010.9 mn. With banks promising recovery process as stated above coupled with necessary measures to curtail cost and improve its core business activities we also believe SEYB would be in a position to benefit from the expected industry wide upside with strong macro economic position of the country. Based on these assumptions we are expecting a 78% YoY increase in projected 2010E earnings to LKR1,010.9 mn and projected 2011E earnings to rise by 30% to LKR1,316.3 mn.

Non voting share offers good value on 10.9x forecasted 2010E earnings. The non voting share which is trading at a near 44% discount to the voting share offers good value on 10.9x (compared to the sector PE of 13.8x) forecasted 2010E earnings and is attractive at 8.4x forecasted 2011E earnings whilst trading on 1.0x PBV. Given the above assumptions on recovery and industry wide upside we rate SEYB (Non Voting) a BUY.

The voting share is trading near 50% premium to the financial sector, However we believe given SEYB’s branch network and reach and the recovery in its core business coupled with the reviving macro economy and growth potential in the banking sector SEYB has further upside, hence we rate SEYB (Voting share) a HOLD.

Overview
Banking sector overview
Sri Lanka’s banking and financial services sector has been a steady contributor to the economy (10.3% to the GDP in 2009) and been one of the most sought after sectors in the Colombo bourse (that gained nearly 110% in terms of market capitalization and sector index gained near 124% during the year 2009). We saw the asset quality in the banking sector deteriorating in the recent past due to high interest rates and inflationary environment coupled with the weakening macro environment both globally and locally, despite the healthy capital adequacy levels that the banks maintained throughout.

Nevertheless, with the improving macro economic outlook for Sri Lanka and easing interest rates and inflation we expect the banking sector to be a prime beneficiary of this positive momentum. Further we expect that with the end of the 3 decade long seperatist conflict which has opened up a vast cash rich area will provide ample opportunities for banks to grow in the coming years.

Lower lending rates coupled with vast development projects which are underway in the island will enable the banks to grow their loan portfolios. Further with North and East integrated into the economy we foresee branch network of the banks expanding (near 35 new branches were opened after May 2009) and we can expect a growth in their deposit portfolios. In addition, the local banking industry is highly regulated and the issuance of new banking licenses in virtually a non-sorter as Central Bank of Sri Lanka (CBSL) discourages new entrants where we already have circa 23 players (both local and foreign). This provides the existing operators to enjoy the benefits of this upside. Going forward with the favorable economic outlook, growth potential of banks due to healthy capitalization levels and improving asset quality in the banking sector we see the sector performing above expectations in the coming years.

Company overview
Seylan Bank was incorporated in 1987 and obtained a listing for its ordinary shares on the Colombo bourse in 1989. Today the bank stands as the 4th largest private commercial bank in Sri Lanka with an asset base of LKR142.9 bn whilst operating an island wide branch network of 94.

From the inception the bank was more focus on the retail sector offering differentiated (5% bonus on interest reinvested in fixed deposits, 1% bonus interest on minimum balances of savings accounts) and customer oriented services (extended weekday banking hours as well as Saturday banking). SEYB enjoyed immediate success reporting an after tax profit of LKR11.3 mn in 1988 where the profitability has grown at a 19 year CAGR of 26% from 1988-2007. In 2008 bank faced a confidence crisis where customers were demanding for withdrawals due banks associates with Ceylinco group (held near 24%) and the SEYB recorded a loss of LKR143.0 in 2008. Today the bank is recovering from the crisis situation under the new management and the bank has potential for upside (along with the expected industry upside) given the bank will return to its normal operating levels by end of 2010.

The chain of events that happened in year 2008 led to the historic run on SEYB in late 2008 due to failure of financial institutions and loss public confidence in September 2008 an unlisted finance company “Sakvithi Investments” defrauded a near LKR900 mn worth of deposits (individual responsible for the fraud fled the country) after luring exceptionally high rates of returns.

With the instability and fear created by these unregistered finance companies made depositors demand back their funds at Golden Key (which was offering higher rates of 24-30% p.a.) a Ceylinco owned company. Finally all these incidents led to collapse of Golden Key and directors were sued for management malfunction.

Subsequent to the Golden Key crisis there was a run on SEYB where, by then the Ceylinco group (was the holding company of Golden Key) held 24% of the bank and Dr. Lalith Kotelawala who was the chairman of Ceylinco group was also the chairman/managing director of SEYB by that time.

Further bank also had reckless related party lending to most of the Ceylinco group companies which brought about huge NPL’s (peaked up to LKR30 bn in 2008) from Ceylinco group companies after most of them collapsed.

Recovery process under new management
In December 2008 Ceylinco group divested its interest in SEYB where two state institutions (Sri Lanka Insurance Corporation and Bank of Ceylon) bought 25% of SEYB becoming the largest shareholder as at 31st December 2009. Following the take over, CBSL handed over the management of SEYB to Bank of Ceylon and was asked to appoint a new board in the meantime. Decisive action by CBSL to restore SEYB from its crisis was commendable and it also protected the entire financial services sector from further crisis. Under the new management the main priority was to restore public confidence and adopt appropriate risk management strategies.

Future outlook
During latter part of 2009 and 1Q2010 SEYB showed signs of recovery where they were able to bring down the NPL's (from a high of LKR31 bn in 2009 to near LKR27 bn by 1Q2010), curtail costs (near 20% YoY reduction in 2009), improve capital adequacy, strengthen liquidity position (stood at 29% end of 2009 compared to regulatory limit of 20%), improve net interest income and increase foreign remittances.

The bank drew up a 3 year strategic plan from 2009-2011 emphasizing to improve seven key performance indicators such as ROE, NPL ratio, cost to income ratio, profit after tax etc. Further the bank also has taken necessary steps to attract deposits, improve recoveries and managing its business risks. It is also noteworthy that with all these healing processes the bank is also looking at expansion plans for growth mainly in North and East.

Deposits
SEYB’s deposits recorded a steady growth during 2002-2004 where it saw a sizeable leap in 2005 but from 2005 onwards growth in customer deposits slowed down. Banks deposit base dropped considerably in 2008 mainly on the back of global financial turmoil and high inflationary situation in the country. However after 2008 the banking sector deposit growth recovered with declining inflation and recovery in the global crisis (9% YoY growth) in contrast SEYB recorded negative growth mainly because of the internal crisis (Ceylinco group crisis) the bank under went during 2H2008 and early 2009. With the new management in place and sound credit policies adopted the bank has been able build up the confidence of the customer where it has helped to attract the lost deposits to the bank (deposits recoded a marginal 1.5% growth in 1H2010).

Therefore going forward with the improving macro economic conditions and the upside in the banking sector we believe SEYB would be able to recover its lost deposits and will return to normalcy during the next 2 years which would help them to grow from there onwards.


Another positive sign we are seeing the banking sector is the shift in the deposit mix towards low cost CASA products. This is evident in SEYB as well where they have been able to grow its savings products whilst reducing the dependence on high cost time deposits. In 2008, 64% of SEYB’s total deposits came from time deposits where as the contribution from CASA was 36% which was mainly due to high interest rates prevailed at that time. But during 1H2010 saw a 42% contribution from CASA which has helped the bank to reduce their interest cost.


From the total deposits Western province contributes to near 65% where the bank operates 46 branches with average deposit base of LKR1.5 bn per branch. 8 branches in the North & East contributes 5% of to the total where the average deposit base per branch stands near LKR0.8 bn. Going forward with the newly liberated North & East integrated into the main stream economy we expect the contributions from the North & East branches to increase.

Loans
SEYB’s loan growth surged from 2001-2005 at a CAGR of 20.4% mainly backed by the industry wide growth momentum. However we see a notable dip in banks loan growth from 2006-2008 due to contractionary monetary policies adopted by CBSL to curtail inflation coupled with the heightened conflict situation which discouraged new investments.

We saw the industry loan growth slowly recovering from 2008 onwards where as SEYB recorded a 23% dip in its loan book in 2009 which was the largest contraction compared to its peers. This was mainly due to the high proportion of the loans being categorized as non performing loans. (2009 SEYB had the highest NPL ratio of 29.3%) During 1H2010 we saw a marginal dip of 1% in banks net loans due to growth slower private sector credit growth during 1H2010 but we saw an improvement in the NPL position of SEYB in 1H2010. (NPL ratio during 1H2010 stood at 25.6%).


In terms of the sector wise break down we see majority of the loans granted to the housing sector where it contributed for circa 17% of the total loan book whilst consumption sector contributed for 10%. However it is also note worthy that housing and consumption sectors are the sectors that will mostly affect the asset quality.

SEYB is concentrated more on short term loans where it is circa 51% of the total portfolio where as medium term loans contribute 25% and contribution from long term loans stands at 24%. Further SEYB from the inception had more focus on the retail segment (which yield higher margins) and currently operate at a retail : corporate mix of near 70:30. Bank also has seen increasing demand in its pawning business (which is a highly profitable business with low risk) specially from Northern province, where currently pawning contributes for circa 6-7% of the total advances.

Interest Margin
SEYB has been able to enjoy above 5% interest margins during the last five years (even in times of crisis) due to its retail focus and differentiated service. Banks interest margin of 5.5% was in line with the industry average of circa 5%.


Asset Quality
SEYB’s non performing loans (NPL) were at manageable levels (gross NPL ratio near 8%) during 2005-2008 but with reckless lending patterns which resulted in NPL’s to peak up to near LKR30 bn in 2009 whilst the gross NPL ratio for 2009 stood at 29.3% (which was the highest in the industry). However with the emphasis on recovering the bad loans under new management we saw a reduction in NPL’s in 1H2010 which stood at LKR27.5 bn however the gross NPL ratio is still the highest in the industry at 25.6% (industry NPL ratio is circa 8%).


Capital Adequacy
Bank has improved its capital position after it fell below regulatory limits in 2008 where the Tier II CAR stood at 9.4% vs 10% regulatory limit. Bank is comfortable with its current capitalization level (Tier I at 10.6% and Tier II at 12.8% compared to regulatory limits of 5% & 10%). Further Fitch Ratings Lanka Ltd’s rating on SEYB is BBB+ and the outlook is stable.

Financial Performance
SEYB was growing gradually during 2005-2007 where the major set back occurred in 2008 where the group recorded a loss of LKR143.0 mn. It is also noteworthy in 2008 banks operating cost increased exceptionally than its NII largely owing to high provisioning costs. However we saw the bank improving its performance during 2009 under the new management where the bank recorded a profit of LKR569.2 mn (up 498% YoY). Main reason behind improvement in operations was reducing operating costs and provisions despite business volumes were contracted. Further it is also encouraging to see SEYB recording a profit of LKR507.3 mn in 1H2010.


In terms of profitability ratios we saw SEYB maintained the interest margins at circa 5% levels. However average return on equity and average return on assets fell drastically below industry average in 2008 due to poor utilization of shareholder funds and mismanagement of resources. But bank recovered during 2009 which was reflected in its profitability ratios where the bank recorded improved ROAE of 9.4% and ROAA of 1.2% (Still below industry averages) end of 1H2010.


With higher interest rates we see major contribution (89%) from interest income to total income in 2009. However with rates reducing interest income contribution will decline marginally in the coming years. But we see a notable contribution coming from fee based income in 1H2010 where majority of this is through foreign worker remittances (where total remittances grew by near 14% YoY during 2009). Therefore going forward with the expected circa 15% YoY growth in remittances we believe SEYB will also grow their fee based income part through its partnerships with MoneyGram International, XPRESS MONEY and EzRemit.
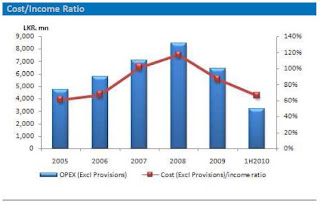

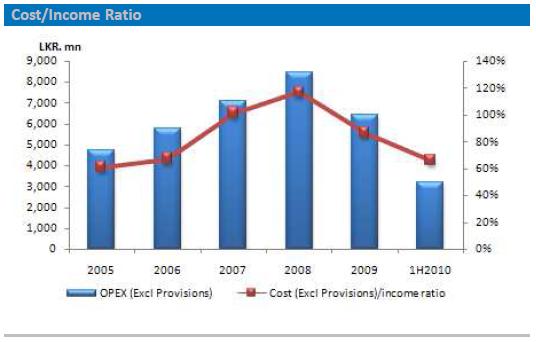
SEYB’s cost to income ratio has been the highest in the industry where it peaked to 117% in 2008 largely owing to higher staff cost. In 2008 bank employed 4,354 employees as compared to 4,041 employed by the largest private commercial bank in the country. Therefore it emphasizes the over staffing problem the bank had over the past hiking up the operating costs. The new management has adopted measures to curtail costs and address the over staffing problem where the bank was able to bring down the cost to income ratio to 66% by 1H2010 (but still was the highest in the industry).


Areas to improve in the future

  • SEYB’s cost to income ratio of 66% is the highest in the industry (where industry average is around 55%) and bank also has an overstaffing issue to address (nearly half the size of countries largest private commercial bank in terms of assets but it employees virtually the same number of employees). Going forward tha bank need to address this issue where we have witnessed the bank’s new management have adopted few cost rationalization strategies to reduce cost.


  • SEYB’s NPL ratio, ranging from just over 11% to more than 25% since reporting began in 1998. Bank has the highest NPL ratio among its peers and exceedingly high compared with the industry average of 8%. Bank adopted various measures to bring down its NPL’s (execute legal action, stop lending to Ceylinco group etc.) where we saw banks gross NPL ratio improving to circa 25% from a high of 29%.


  • Profitability measures such as ROE and ROA fell significantly below the industry norms during the past two years. Therefore the company has to take the challenge of improving the profitability measures in the coming years through its wider reach and improving core business.


Valuation
Forecast 2010E earnings to rise by 78% YoY to LKR1,010.9 mn. With banks promising recovery process where we believe the bank would be able to reduce its NPLs from its current LKR27 bn, adopt necessary measures to curtail cost and improve its core business activities. We also believe SEYB would be in a position to benefit from the expected industry wide upside with strong macro economic position of the country. Based on these assumptions we are expecting a 78% YoY increase in projected 2010E earnings to LKR1,010.9 mn and projected 2011E earnings to rise by 30% to LKR1,316.3 mn.

Non voting share offers good value on 10.9x forecasted 2010E earnings. share has good value on 10.9x (compared to the sector PE of 13.8x) forecasted 2010E earnings and is attractive at 8.1x forecasted 2011E earnings whilst trading on 1.0x PBV. The non voting share which is trading at a near 44% discount to the voting share where the normal discount between the voting and non voting share in the banking sector is 25- 30%. Therefore we believe the gap between SEYB.N and SEYB.X should narrow in the future and given recovery in its core business that we have seen during 1H2010 coupled with the reviving macro economy and growth potential in the banking sector we rate Given the above assumptions on recovery and industry wide upside we rate SEYB (Non Voting) a BUY.

The voting share currently trades at 19.6x projected 2010E earnings and 15.0x on projected 2011E earnings whilst trading on 1.8x PBV. The voting share is trading near 50% premium to the financial sector, However we believe given SEYB’s branch network and reach and the recovery in its core business that we have seen in 1H2010 coupled with the reviving macro economy and growth potential in the banking sector SEYB has further upside, hence we rate SEYB (Voting share) a HOLD.
»»  read more

Sunday, May 16, 2010

Nations Trust Bank (NTB) net profit up 19% YoY to LKR214.1 mn in 1Q2010


Nations Trust Bank's (NTB) net profit has grown by 19% YoY to LKR214.1 mn in 1Q2010, broadly inline with our forecast. The net profit growth in 1Q2010 was driven by a 17.5% YoY growth in net interest income and 56.8% YoY reduction in provisioning costs. With low interest rates and expected economic boom, banking sector outlook remains positive with loan growth expected to gather momentum from 2H2010 onwards, NTB's net interest margins has improved to near 5.5% whilst the young and dynamic bank is set to grow in the coming years . We are maintaining our forecast 2010E net profit at LKR969.7 mn (up 41% YoY) and projected 2011E net earnings at LKR1,296.9 mn (up 34% YoY). Thus the share is attractive on 8.9x forecast 2010E net profit, 6.7x projected 2011E net earnings, 1.2x PBV.


Interest income has dipped 19% YoY to LKR2,459.2 in 1Q2010. NTB’s interest income has dipped 19.4% YoY to LKR2,459.2 mn in 1Q2010, caused by a 21.9% YoY dip in interest income on loans and advances to LKR1,576.9 mn and a 14.4% YoY dip in Interest income on other interest earning assets to LKR 882.2 mn. The interest income on loans and advances have dipped despite the 8% YoY increase in performing loans mainly on the back of low interest rates. Though the holding of government securities has grown by circa 20% YoY, the dip in Treasury bill rates has impacted the income from fixed income securities negatively.

Interest Expenses has dipped 35% YoY to LKR1,396.2 mn in 1Q2010. Interest expenses has dipped 35% YoY to LKR1,396.2 mn mainly on the back of a 51% YoY dip in interest expense on other interest bearing liabilities as well as a drop of 13% YoY to LKR802.1 mn in interest expense on deposit. The interest
cost was reduced with low deposit rates and shift in the deposit mix towards low cost CASA products. The reduction in other interest bearing liabilities cost is largely attributable to reduction in money market  borrowings.

Net interest income has increased by 17% YoY to LKR1,063.0 mn in 1Q2010. Despite interest income having dipped by 19% YoY interest cost has dipped at a faster pace by 35% YoY enabling the net interest income grow by 17% YoY to LKR1063.0 mn.


Non interest income has reduced by 29% YoY in 1Q2010. Non interest income has reduced by 29% YoY to LKR434.1 mn in 1Q2010 due to forex earnings falling by 62% YoY to LKR60.4 mn and other income also fell by 18% YoY to LKR373.7 mn.

Operating costs have marginally increased by a mere 0.5% YoY in 1Q2010. Operating costs have marginally increased by a mere 0.5% YoY to LKR852 mn, which was resulted by a 3% YoY decrease of other operating expenses to LKR 300 mn. Personal cost has increased by 3% YoY to LKR344 mn which could be attributable to the increase in the number of employees. Further the premises, equipment and establishment expenses have increased marginally by 2% YoY to LKR196 mn.

Provision for bad and doubtful debts and loans has decreased by 57% YoY in 1Q2010. Provision for bad and doubtful debts and loans has decreased by 57% YoY to LKR114.7 mn, which was resulted by the 63% YoY decrease in specific-provision to LKR 96.7 mn. Further NTB's gross NPL ratio is at 7.1% and net NPL ratio of 3.8%.

Total tax bill has increased 41% YoY to LKR316.3 mn in 1Q2010. Value Added Taxation on banking income has increased by 29% YoY to LKR93.8 mn whilst tax on consolidated profit has also increased by 47% YoY to LKR222.6 mn which increased the total tax bill by 41% YoY to LKR316.3 mn in 1Q2010. Thus the effective tax rate in 1Q2010 is near 60%.

Net profit up 19% YoY to LKR214.1 mn in 1Q2010. Consequently a 17% YoY increase in net interest income and 57% YoY reduction in provisioning cost has pushed up NTB's net profit by 19% YoY to LKR214.1 mn in 1Q2010.


Forecast 2010 net profit maintained at LKR969.7 mn (up 41% YoY). With the expected growth in the economy and low interest rate environment the banking sector outlook remains positive with loan growth expected to gather momentum 2H2010 onwards, NTB's net interest margins is expected to be intact at around 5%, whilst the young and dynamic bank is set to grow in the coming years. Therefore, we are maintaining our forecast 2010E net profit at LKR969.7 mn (up 41% YoY) and projected 2011E net earnings at LKR1,296.9 mn (up 34% YoY).

Share is attractive on 8.9x forecast 2010 net profit. The share is attractive on 8.9x forecast 2010E net profit, 6.7x projected net 2011E earnings, 1.2x PBV.

Courtesy - Asia Research
»»  read more

Saturday, May 15, 2010

NDB Bank's net profit down 34% YoY in 1Q2010


National Development Bank’s (NDB) net profit has decreased by 34% YoY to LKR299.3 mn in 1Q2010. The net profit dip during 1Q2010 was mainly attributable to the drop in net interest income by 8.5% YoY and 19.6% YoY increase in operating cost. Thus the gains made in other income, improvement in provisioning costs and reduction in tax bill has not been able to off set the negative impact.

The loan growth expected to gather momentum 2H2010 onwards, NDB’s net interest margins would continue to be intact at around 4.0% - 4.5%, whilst continuing to be unbothered with the industry NPL’s since enjoying the upside of the best quality asset book. Further without exceptional capital gains from bonds during 2009 we maintain our 2010E forecast at LKR1,556.7 mn (down 27% YoY) and 2011E net profit forecast at LKR1,809.6 mn (up 16% YoY). The share continues to offer good value trading on 11.2x forecasted 2010E earnings and 9.6x forecasted 2011E earnings whilst trading on 1.1x PBV.


Interest income has fallen 17% YoY to LKR2,556.4 mn in 1Q2010. NDB's interest income has fallen by 17.3% YoY to LKR2,556.4 mn in 1Q2010, mainly due to a 21.4% YoY dip in interest income from loans and advances to LKR1,678.5 mn whilst interest income from fixed income securities has also dipped by 8.1% YoY to LKR878.0 mn. The dip in interest income from loans and advances is on the back of low interest rates though performing loans have recorded a 3.3% YoY growth. The 21.5% YoY reduction in the Treasury Bill and Bond portfolio (held to maturity) to LKR15.5 bn (which is approx.16% of the banks' asset base) has resulted negatively on income from fixed income securities.

Interest expenses have reduced 23% YoY to LKR1,499.2 mn in 1Q2010. Group's interest expenses have reduced 22.6% YoY to LKR1,499.2 mn in 1Q2010, on the back of 44.5% YoY reduction in other interest bearing liabilities to LKR578.5 mn which is largely attributable to 8.8% YoY dip in borrowings.

Net interest income has dropped 9% YoY to LKR1,057.2 mn in 1Q2010. The dip in interest expenses has not been able to off set the reduction in interest income which has resulted in a 8.5% YoY drop in net interest income to LKR1,057.2 mn in 1Q2010.

Non interest income has risen by 13% YoY in 1Q2010. Non interest income has grown by 13% YoY to LKR551.5 mn in 1Q2010 where it was mainly supported by 3.8% YoY increase in other income to LKR352.2 mn and increase in foreign exchange income by 8.6% YoY to LKR167.8 mn.


Non interest expenses have increased by 20% YoY in 1Q2010. Non interest expenses have increased 19.6% YoY in 1Q2010 mainly on the back of 22.9% YoY increment in personnel cost to 346.5 mn and near 17% YoY increase in other overheads to LKR374.3 mn. Increase in operating expenses were driven by branch expansions carried out by the bank.

Provisioning cost has dipped 34% YoY to LKR70.4 mn in 1Q2010. Total provisioning cost has dipped 34.3% YoY to LKR70.4 mn due to a 53.3% YoY reduction in specific provision to LKR89.1 mn and 13.7% YoY improvement in recoveries to LKR70.5 mn during 1Q2010. However the quality of NDB’s
loan book is unmatched with the gross NPL ratio at 2.4% (vs. an industry average of approx. 7%) and the net NPL ratio at 0.5%.

Total tax bill has reduced 20% YoY to LKR408.6 mn in 1Q2010. Value Added Taxation on banking income has reduced 8.6% YoY to LKR167.3 mn whilst tax on consolidated profit has also reduced 25.9% YoY to LKR241.3 mn enabling to reduce the total tax bill by 19.7% YoY to LKR408.6 during 1Q2010.

However effective tax rate remained at circa 52% levels. Net profit down by 34% YoY to LKR299.3 mn in 1Q2010. Consequently with 8.5% YoY dip in net interest income, 19.6% YoY increase in operating
expenses, NDB’s net profit has reduced by 34.1% YoY to LKR299.3 mn in 1Q2010.


Forecast 2010E net profit maintained at LKR1,556.7 mn (down 27% YoY). With private sector credit growth to gather momentum 2H2010 onwards coupled with improving economic conditions the banking sector outlook remains positive. NDB’s net interest margins would continue to be intact at around 4.0% - 4.5%, whilst continuing to be unbothered with the industry NPL’s since enjoying the upside of the best quality asset book. Further without exceptional capital gains from bonds during 2009 we maintain our 2010E
forecast at LKR1,556.7 mn (down 27% YoY) and 2011E net profit forecast at LKR1,809.6 mn (up 16% YoY).

Share offers good value on 11.2x forecast 2010E net profit. The share continues to offer good value, trading on 11.2x forecasted 2010E net profit and 9.6X forecasts 2011E earnings and 1.1X PBV

Courtesy - Asia Research
»»  read more

Friday, April 30, 2010

Sampath Bank : Net profit up 50.6% YoY to LKR 598.4mn

  • Net profit increased 50.6%YoY to LKR 598mn in 1Q2010 compared to LKR 397.4mn in 1Q2009. This increase was mainly due to the expenses falling at a faster rate than the fall in income of SAMP.
  • Forecast 2010 net profit is LKR 2,393.8 mn (up 15.5% YoY). With interest rates stabilizing (3 month Treasury Bill rates having fallen from 20.6% last year to 8.26%) the banking sector outlook remains positive with loan growth expected to continue the momentum in FY2010 due to the post war growth potential in the industry. SAMP's net interest margin is expected to be intact at around 5.3%, whilst continuing to benefit from the wider reach facilitated by the current 143 branches and new branches expected to open this year. Therefore a 15% YoY increase to LKR 2,393.8mn is likely for FY2010E and 14% YoY increase to LKR 2,736mn for FY2011E.
  • Share offers good value on 8.86X forecast 2010 net profit. The share is attractive where the share is trading at 8.86X forecast 2010 net profit, 7.76X projected 2011net profit earnings. PBV is at 1.32X forecast 2010 net profit and 1.13X forecast 2011 net profit.


Interest income reduced by 9.6% YoY during 1Q2010. This was due to a 13.7% YoY decrease in interest income from loans and advances to LKR 3,570.9mn. The loan book grew by 4.6% during the quarter due to interest rates falling. Interest income on other interest earning assets increased 4.8% to LKR 1,231mn YoY. Overall for 1Q2010, income reduced 10.3% YoY to LKR 5,480.3mn.

Interest expenses dropped by 28.4% in 1Q10 to LKR 2,561.2mn compared to 1Q09 of LKR 3,577.8mn. Interest expenses on deposits dropped 22% YoY, while interest expenses on other interest bearing liabilities dropped 57.9% YoY. Total deposits increased 5.4% during the quarter to LKR 132.8Bn from 126Bn in Dec2009.


Interest income has reduced 9.6% YoY during 1Q2010. Interest income reduced by 9.6% YoY during 1Q2010. This was due to a 13.7% YoY decrease in interest income from loans and advances to LKR 3,570.9mn. The loan book grew by 4.6% YoY during the quarter due to decreasing interest rates. Interest income on other interest earning assets increased 4.8% YoY to LKR 1,231mn. Overall for 1Q2010, income reduced 10.3% YoY to LKR 5,480.3mn.

Interest expenses have dropped 28.4% YoY. Interest expenses dropped by 28.4% YoY in 1Q10 to LKR 2,561.2mn compared to 1Q09 of LKR 3,577.8mn. Interest expenses on deposits dropped 22% YoY, while interest expenses on other interest bearing liabilities dropped 57.9% YoY. Total deposits increased 5.4% during the quarter to LKR 132.8Bn from 126Bn in Dec2009.

Net interest income has increased 29.4% YoY to LKR 2,240.7mn. During 1Q2010, despite interest income dropping 9.62% QoQ, interest costs dropped at a sharper pace of 28.4% which resulted in the 29.4% increase in net interest income.

Non interest income dropped 14.8%YoY. Non interest income dropped 14.8%YoY due to Foreign exchange income dropping 55.1% YoY in 1Q2010. However a 11% increase was recorded from other income.

Non interest expenses increased 17.2%YoY. Non interest expenses increased 17.2% YoY from LKR 1,272.5mn in 1Q2009 to LKR 1,490.9mn YoY in 1Q2010. This was mainly due to personnel costs increasing 20.5% to LKR 664.2mn from LKR 551mn YoY in 1Q2010.

Net interest margin increased to 5.59%. Net interest margin increased to 5.59% in 1Q2010 compared to 5.07% in 1Q2009. This helped the bank increase its profitability during the quarter.
Provisions have increased 121.8% YoY in 1Q2010. Provisions have increased 121.8% YoY in 1Q2010 to LKR 303.8mn. General provisions recorded a 100% YoY increase to record LKR 14.5mn. Specific provisions too have increased by 164.4% YoY to LKR 713.7mn. However recoveries have increased drastically during 1Q2010 by 219.1% YoY to LKR 424.5mn.

Operating profit has risen 21.7% YoY. Operating profit rose 21.7% YoY during 1Q2010 to LKR 1,186.4mn compared to LKR 974,996mn in 1Q2009. Furthermore the cost to income ratio increased to 61.4% in 1Q2010 from 55.75% in 1Q2009.

Total tax bill reduced 6.8% YoY to LKR 581,869mn. Total tax bill has reduced 6.8% in 1Q2010 YoY to LKR 581,869mn. This is mainly due corporate tax expenditure reducing by 29.5%.however the VAT on Financial services has increased by 22.4% Net profit up 50.6% YoY to LKR 598.411mn.

Consequently Net profit increased 50.6%YoY to LKR 598mn compared to LKR 397.4mn 1Q2009. This increase was mainly due to the expenses falling at a faster rate than the fall in income of SAMP. CAR (Tier 1 - Min 5%) increased to 10.26% (Tier 2 - Min 10%) 13.43%. Tier 1 CAR reduced marginally from 10.64% as at Dec2009 to 10.26% in 1Q2010 and Tier 2 CAR reduced from 13.87% in Dec2009 to 13.43% in 1Q2010.

Forecast 2010 net profit is LKR 2,393.8 mn (up 15.5% YoY). With interest rates stabilizing (3 month Treasury Bill rates having fallen from 20.6% last year to 8.26%) the banking sector outlook remains positive with loan growth expected to continue the momentum in FY2010 due to the post war growth potential in the industry. SAMP's net interest margins is expected to be intact at around 5.3%, whilst continuing to benefit from the wider reach facilitated by the current 143 branches new branches expected to open this year. Therefore a 15% YoY increase to LKR 2,393.8mn is likely for FY2010E and 14% YoY increase to LKR 2,736mn for FY2011E.

Share offers good value on 8.86X forecast 2010 net profit. The share is attractive where the share is trading at 8.86X forecast 2010 net profit, 7.76X projected 2011net profit earnings. PBV is at 1.32X forecast 2010 net profit and 1.13X forecast 2011 net profit.


Sri Lanka Equity Analytics
World Trade Centre
Colombo, Sri Lanka
Email: info@srilankaequity.com
Web: www.srilankaequity.com
»»  read more